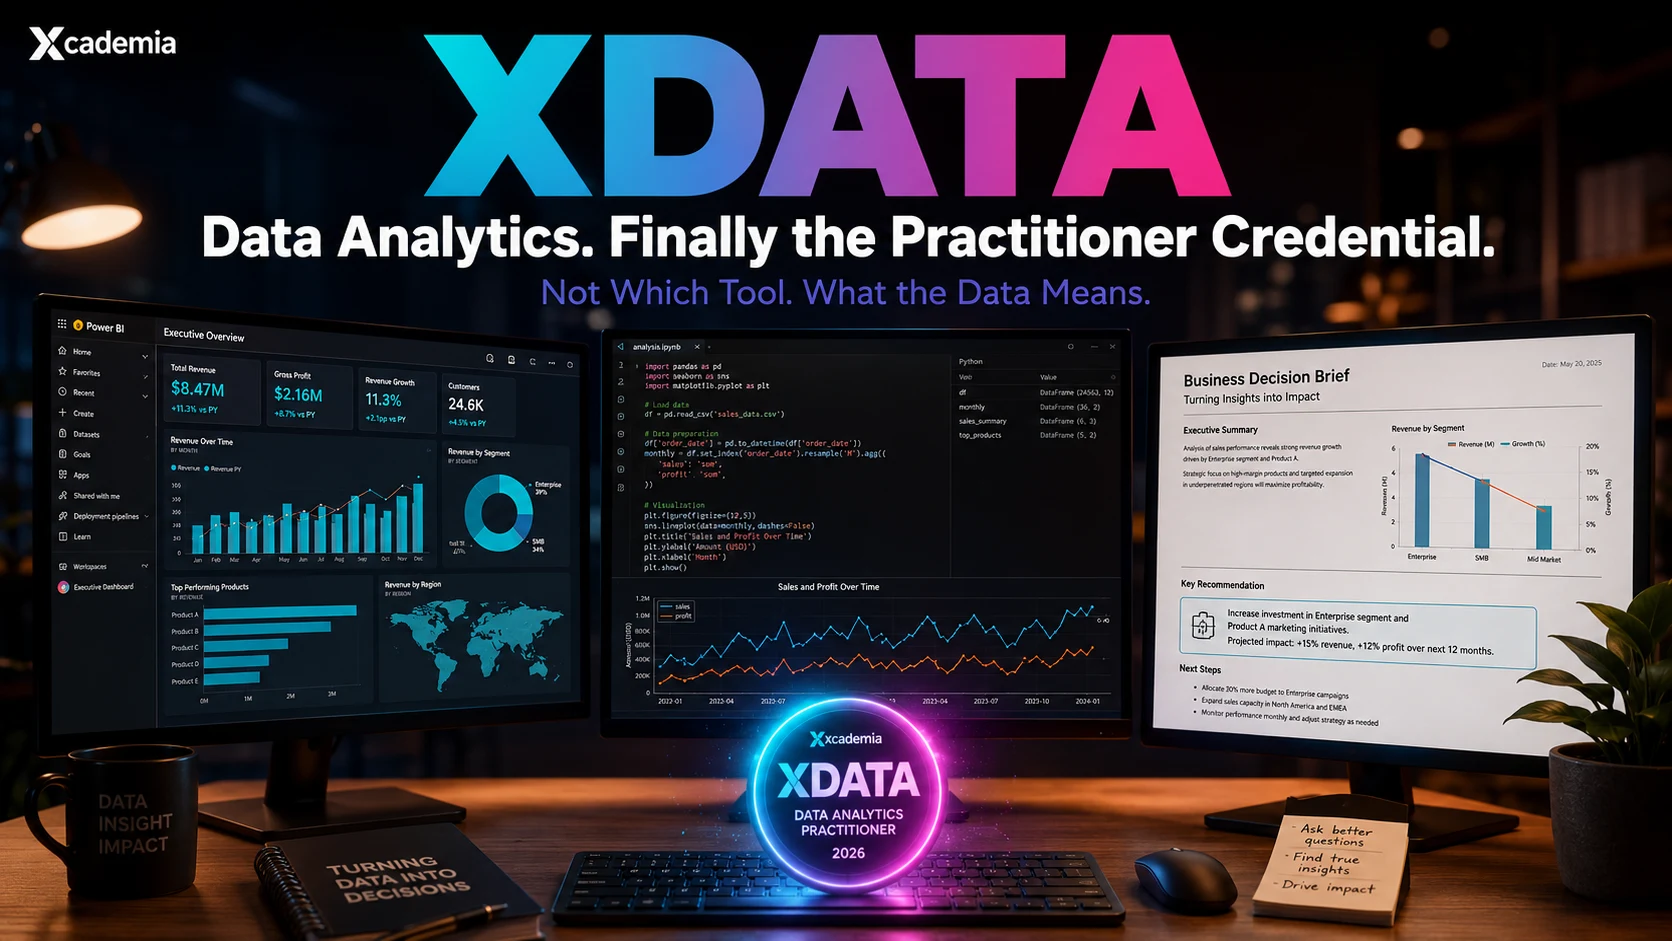
XDATA: Xcademia Data Management Practitioner
Most data analytics certifications test whether you can use the tools. XDATA tests whether you can answer the business question. From hypothesis framing and statistical analysis to Power BI, Python, and executive communication, it assesses applied analytical judgement.
The Data Analytics Practitioner Certification for 2026
The data analytics certification market has a specific problem. Most credentials test whether you can use the tools: can you build a Power BI dashboard, can you write a SQL query, can you run a Python regression? These are valuable skills. They are not the same as data analytics capability.
Data analytics capability is the ability to ask the right question of the right data, apply the appropriate analytical method, interpret the result correctly in its organisational context, and communicate the insight in a way that produces a decision. Tool proficiency is a prerequisite. Analytical judgement is the thing itself.
XDATA is Xcademia's Data Analytics Practitioner certification. Five instructor-led days. Practitioner-assessed. Built around the analytical capability that produces useful insight, not just technically correct outputs.
The data analyst who can build a beautiful dashboard is not the same as the one who can tell you whether the trend it shows is real, what is causing it, and what the organisation should do about it. XDATA develops and assesses the second capability. The tools are a means to that end.
What Existing Certifications Miss
Microsoft PL-300 (Power BI Data Analyst Associate)
PL-300 is a well-constructed certification for Power BI implementation. It covers data preparation, modelling, visualisation, and Power BI service management. It tests whether you can build and deploy Power BI solutions correctly. It does not test whether the analysis you are building is the right analysis for the business question being asked, whether the data you are modelling is fit for purpose, or whether the insight your dashboard presents is being interpreted correctly by its audience.
Google Data Analytics Certificate
The Google certificate is a valuable entry pathway that covers the data analytics lifecycle across spreadsheets, SQL, R, and Tableau. It is well-suited for career changers entering data analytics. The assessment is portfolio-based rather than examinations, which is its strongest feature. The limitation: it is a foundational credential that covers breadth rather than depth in any particular analytical domain.
IBM Data Analyst Professional Certificate
Similar in structure to the Google certificate: a comprehensive introduction covering Python, SQL, visualisation, and the data analysis process. Again, portfolio-assessed and well-structured as a foundation. As with the Google credential, the limitation is that it develops foundational tool proficiency rather than the applied analytical judgement that mid-to-senior data analyst roles require.
The tool certifications tell the employer you can use the software. XDATA tells the employer you can answer the business question the software was asked to address. Both matter. Only one is the actual job.
What XDATA Covers Across Five Days
Day 1: Analytical Thinking and Problem Framing
Translating business questions into analytical problems: The gap between "we need a dashboard" and a clearly defined analytical question with measurable success criteria
Data landscape assessment: Identifying what data is available, what is missing, what proxy measures can substitute, and when the data is insufficient to answer the question reliably
Hypothesis-driven analysis: Framing analytical work around testable hypotheses rather than exploratory browsing
Lab: Frame three realistic business scenarios as analytical problems with defined questions, hypotheses, data requirements, and success criteria
Day 2: Data Preparation and Quality Assessment
Data profiling in practice: Assessing completeness, accuracy, consistency, and timeliness before analysis begins
Data cleaning methodology: Handling missing values, outliers, duplicates, and inconsistent categorical data with documented reasoning
SQL for analytical data preparation: Joins, window functions, CTEs, and analytical query patterns
Python with pandas: Data manipulation, reshaping, merging, and preparation for analysis
Lab: Clean and prepare a realistic messy dataset for a defined analytical question. Document every decision and its rationale
Day 3: Statistical Analysis and Interpretation
Descriptive statistics applied: Knowing when mean is wrong and median is right, understanding distributions, identifying the statistics that answer the specific question
Correlation vs causation in practice: The most common analytical error and how to avoid making it in client and board presentations
Regression analysis: Building, interpreting, and presenting regression models for business questions
Segmentation and cohort analysis: Customer lifetime value, retention analysis, cohort comparison — the analytics that drive business decisions in most commercial organisations
Lab: Conduct a full statistical analysis of a realistic commercial dataset, producing findings with confidence levels and explicit acknowledgement of limitations
Day 4: Visualisation and Communication
Choosing the right chart for the right question: The systematic approach to selecting visualisation types rather than defaulting to the familiar
Building dashboards for decisions: The difference between a dashboard that shows data and one that answers the question the user needs to make a decision
Power BI applied: Building a decision-focused dashboard for the Day 3 analysis findings
Communicating analytical uncertainty: How to present findings that have confidence intervals and limitations in a way that is honest without undermining the usefulness of the analysis
Executive communication of data: The one-slide summary that produces a decision versus the twenty-slide deck that produces confusion
Day 5: Applied Analytics and Capstone
A/B testing and experimentation: Designing, running, and interpreting business experiments
Predictive analytics basics: Building simple predictive models for business applications: churn prediction, demand forecasting, risk scoring
Analytics for AI: Understanding how analytical work supports AI model development, feature engineering, training data assessment, model performance interpretation
Capstone: A full analytical engagement from business question to board presentation. Candidates receive a realistic commercial scenario and dataset, frame the analytical question, prepare and analyse the data, produce the findings, and present a decision recommendation to a simulated executive audience. Assessed by a senior Xcademia data and analytics practitioner. Verifiable at xcademia.com/verify.
The XDATA capstone is the analytical engagement from start to finish: question framing, data preparation, statistical analysis, visualisation, and executive presentation. Five days of development assessed in one integrated exercise that mirrors the actual analyst's job.
COMPARISON: TOOL CERTS VS XDATA
Tool certs (PL-300 / Google / IBM) | XDATA (Xcademia) | |
|---|---|---|
Focus | Specific tool or platform proficiency | Applied analytical capability across tools |
Assessment | Exams or portfolio (tool tasks) | Practitioner capstone: question to decision |
Duration | Weeks to months (self-study) | 5 intensive instructor-led days |
Analytical framing | Not assessed | Core capstone component |
Statistical reasoning | Introduced (Google/IBM) / not assessed (PL-300) | Applied throughout; correct interpretation assessed |
Communication | Not assessed | Executive presentation as capstone component |
Market recognition | Strong (especially PL-300 for Power BI roles) | UK and UAE, growing |
What it proves | You can use the tool | You can turn data into a decision |
Tool Certs best for specific platform roles:
PL-300 is a strong credential for Power BI-specific roles and is valued by Microsoft-aligned organisations. Google and IBM certificates are excellent foundation credentials. All three are worth pursuing for their market access and tool-specific credibility.
XDATA best for applied data analytics capability:
XDATA develops and assesses the analytical capability that underpins all data analytics work: question framing, data preparation, statistical reasoning, visualisation for decisions, and executive communication. Five days. Practitioner-assessed. No MCQ. No renewal. Verifiable at xcademia.com/verify.
Build Applied Data Analytics Capability With XDATA XDATA: five instructor-led days covering analytical thinking, data preparation, statistical reasoning, Power BI, Python analytics, and executive communication. Applied capstone from business question to board presentation. Practitioner-assessed. No MCQ. No renewal. Verifiable at xcademia.com/verify. Explore XDATA |
|---|
Ready to go deeper?
Professional Training
Hands-on, mentor-led training aligned with industry certifications.
About the Author
Sharper every day
Daily tutorials, analysis, and career playbooks across all 12 Xcademia disciplines, straight to your inbox. No spam.