Prometheus Monitoring: A Complete Beginner’s Guide to Metrics, PromQL, Alerting and Application Monitoring
Prometheus is a powerful open-source monitoring tool for modern applications, Kubernetes and cloud infrastructure. Learn how Prometheus collects metrics, how PromQL works, metric types, exporters, Grafana, Alertmanager and how to build a practical monitoring setup.
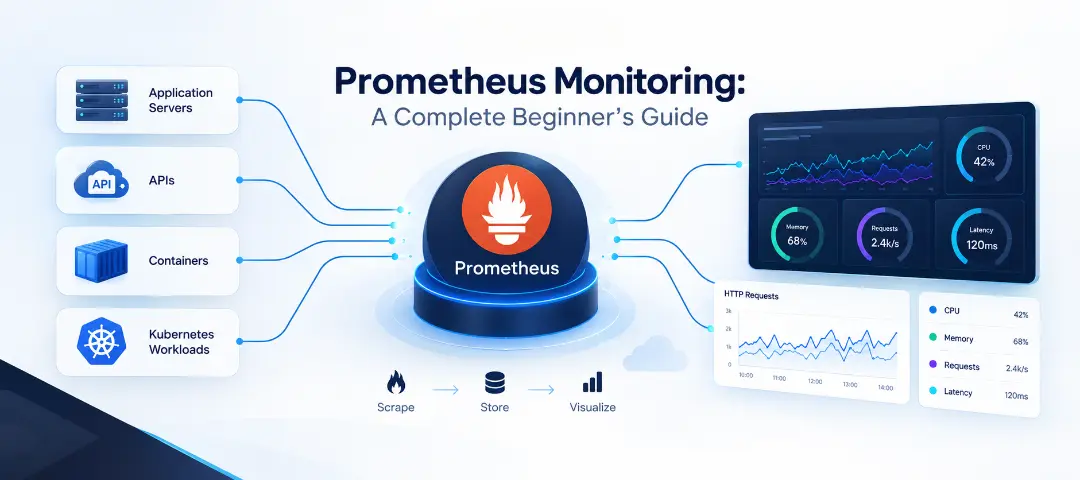
Modern applications are no longer simple servers running a single application. Today, a production system may contain containers, Kubernetes clusters, APIs, databases, microservices, queues, cloud infrastructure, and hundreds of application instances.
When something goes wrong, simply knowing that a server is "up" is not enough.
You need to know:
How many requests are reaching the application?
Are requests becoming slower?
How many requests are failing?
Is CPU usage increasing?
Is memory getting exhausted?
Are containers restarting?
Which service is causing the problem?
When did the problem start?
This is where Prometheus becomes useful.
Prometheus is an open-source monitoring and alerting system designed around collecting and querying time-series metrics. It commonly collects metrics by scraping HTTP endpoints exposed by applications, exporters, and infrastructure targets.
In this guide, we'll understand Prometheus from the ground up and build a practical mental model of how it works.
What Is Prometheus?
Prometheus is an open-source monitoring system that collects numerical measurements from applications and infrastructure and stores them as time-series data.
A time series is essentially:
Metric + Labels + Timestamp + Value
For example:
http_requests_totalcould produce data such as:
http_requests_total{method="GET",status="200"} 15420At another point in time:
http_requests_total{method="GET",status="200"} 15480Prometheus records these values over time, allowing engineers to understand how a system behaves.
The official Prometheus documentation describes the system as a platform that collects metrics by scraping HTTP endpoints exposed by monitored targets.
In simple words
Think of Prometheus as a fitness tracker for your application.
A fitness tracker might record:
heart rate
steps
calories
sleep
Prometheus records:
CPU usage
memory usage
request count
request latency
errors
active connections
The difference is that Prometheus is designed for software systems.
Why Do We Need Monitoring?
Imagine you have an e-commerce application.
Everything looks normal from the outside.
Users can open the website.
The server is running.
The database is running.
But users start complaining:
"The checkout page is very slow."
Without monitoring, your first response might be:
"Let's check the server."
But the server could be perfectly healthy.
The actual problem might be:
Checkout API
     ↓
Database query
     ↓
Slow database response
     ↓
API latency increases
     ↓
Users experience slow checkout
Monitoring helps you identify these changes using measurable data.
For example:
Request Rate:     2,500 req/min
Error Rate:       8%
Average Latency:  2.4 sec
CPU Usage:        42%
Memory Usage:     61%
Now you have evidence about what is happening instead of guessing.
How Prometheus Works
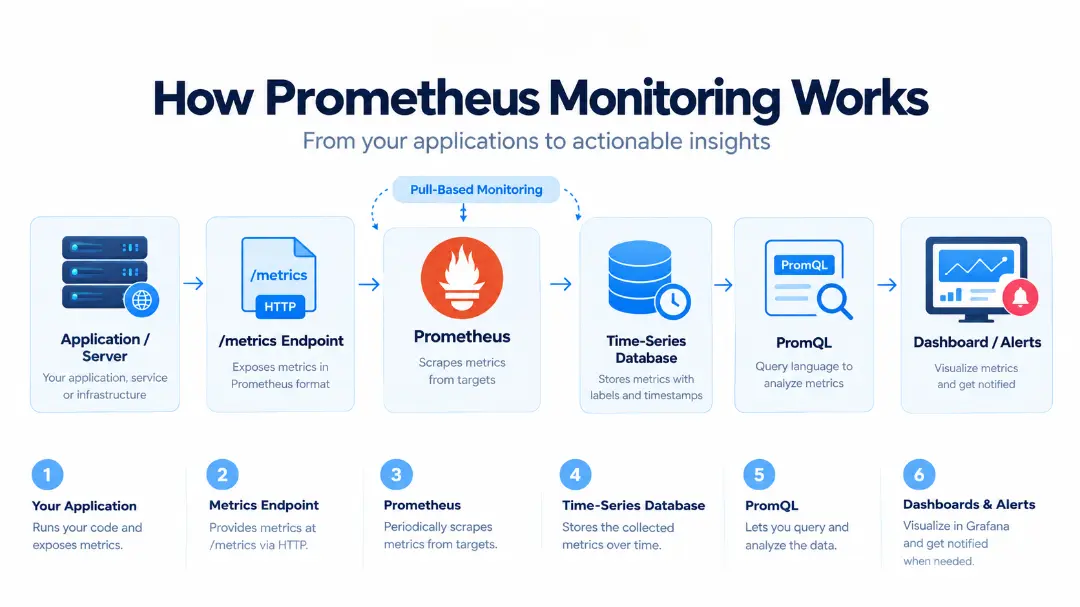
The most important concept to understand is that Prometheus primarily uses a pull-based monitoring model.
Instead of applications continuously pushing metrics to Prometheus, Prometheus periodically requests metrics from configured targets.
The basic flow looks like this:
Application / Server
        │
        │  /metrics
        ↓
   Prometheus
        │
        ├── Stores metrics
        │
        ├── PromQL queries
        │
        ↓
     Grafana
        ↓
    Dashboards
Prometheus periodically scrapes the /metrics endpoint of a target.
For example:
http://localhost:8080/metricsThe endpoint might return:
http_requests_total 15230
http_errors_total 42
memory_usage_bytes 524288000
Prometheus collects these values and stores them as time-series data.
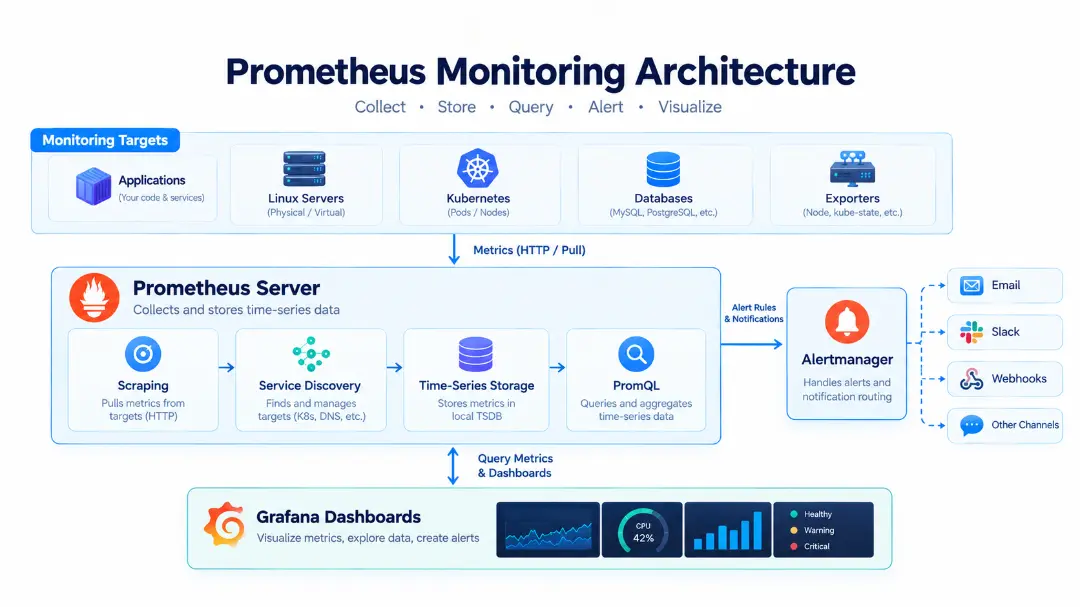
Prometheus Architecture
A typical Prometheus monitoring setup contains several important components.
1. Prometheus Server
The Prometheus server is the central component.
It is responsible for:
discovering monitoring targets
scraping metrics
storing time-series data
evaluating rules
executing PromQL queries
The server contains the main time-series storage used by Prometheus.
2. Targets
A target is something Prometheus monitors.
Examples include:
Linux servers
Kubernetes nodes
applications
APIs
databases
containers
message brokers
A target generally exposes metrics through an HTTP endpoint.
For example:
http://server:8080/metricsPrometheus periodically visits this endpoint and collects the available metrics.
3. Exporters
Not every application exposes Prometheus-formatted metrics directly.
That's where exporters come in.
An exporter collects information from another system and exposes it in a format Prometheus can scrape.
For example:
Linux Server
     ↓
Node Exporter
     ↓
/metrics
     ↓
Prometheus
Node Exporter is commonly used to expose hardware and operating-system metrics.
Exporters are also available for various databases, services, and infrastructure components.
4. PromQL
PromQL stands for Prometheus Query Language.
It allows you to query, filter, aggregate, and analyze time-series data.
For example:
http_requests_totalreturns request-related time series.
You can filter them using labels:
http_requests_total{status="500"}This allows you to focus on HTTP 500 responses.
PromQL supports instant and range queries and provides functions for working with time-series data.
5. Alertmanager
Prometheus can evaluate alerting rules, but Alertmanager is responsible for managing the alerts generated by Prometheus.
It can:
group alerts
deduplicate alerts
route notifications
suppress related alerts
send notifications to supported integrations
A simplified flow is:
Prometheus
    ↓
Alert Rule Triggered
    ↓
Alertmanager
    ↓
Notification
    ├── Email
    ├── Slack
    └── Other integrations
This separates metric collection from alert notification management.
Understanding Prometheus Metrics
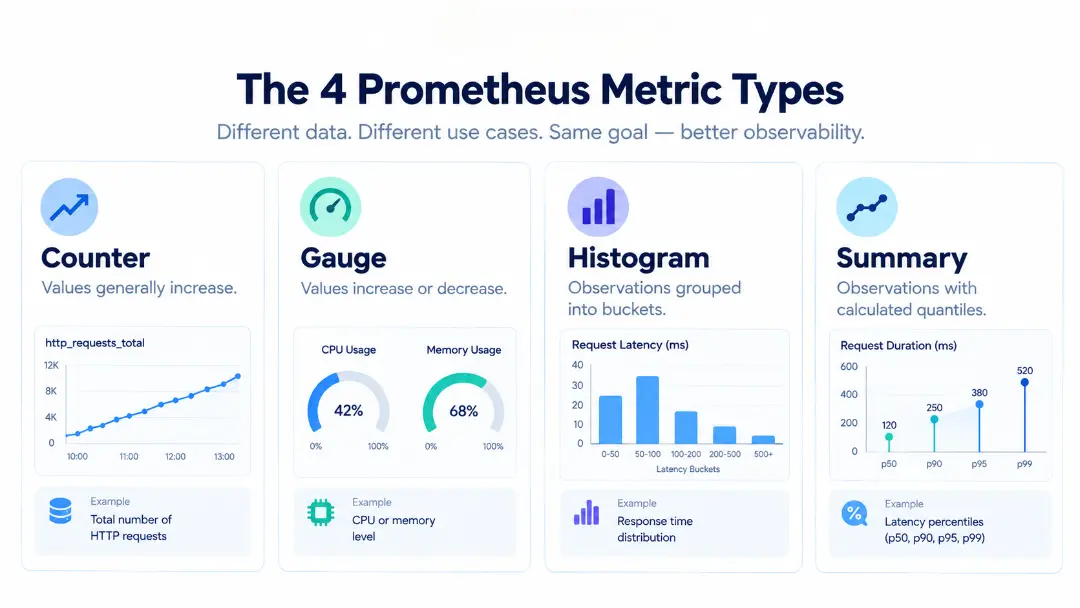
Prometheus provides four core metric types:
Counter
Gauge
Histogram
Summary
Understanding these four is extremely important when instrumenting applications.
1. Counter
A Counter represents a value that generally increases over time.
Examples:
total HTTP requests
total errors
total jobs processed
total login attempts
Example:
api_requests_total 100After another 50 requests:
api_requests_total 150Counters can reset when an application restarts.
You should not use a counter for something that naturally goes up and down, such as current memory usage.
A common PromQL query is:
rate(api_requests_total[5m])This estimates the per-second rate of increase over the last five minutes.
2. Gauge
A Gauge represents a value that can increase or decrease.
Examples:
CPU utilization
memory usage
active connections
number of running processes
queue size
For example:
memory_usage_bytes 500000000Later:
memory_usage_bytes 420000000The value can move in either direction.
This makes gauges appropriate for measurements representing a current state.
3. Histogram
A Histogram measures observations and places them into configurable buckets.
It is particularly useful for measurements such as:
HTTP request duration
response size
database query duration
Suppose your API response times are:
100ms
180ms
250ms
700ms
1.2s
You could create buckets such as:
≤100ms
≤250ms
≤500ms
≤1s
≤2s
This helps you understand the distribution of response times rather than only looking at an average.
Histograms are especially useful when working with latency and service-level objectives.
4. Summary
A Summary also measures observations such as latency and response sizes.
It exposes:
count
sum
configurable quantiles
One important difference is that summaries calculate quantiles on the client side, while histogram-based quantiles can be calculated by Prometheus using PromQL.
For many application-monitoring scenarios, histograms are a useful choice when you need aggregation across multiple instances.
Prometheus Labels
Labels make Prometheus metrics much more powerful.
Consider:
http_requests_totalThis doesn't tell us much.
Now add labels:
http_requests_total{
  method="GET",
  endpoint="/users",
  status="200"
}
We can now distinguish:
GET /users 200
GET /users 500
POST /users 200
POST /users 400
Labels allow you to filter and aggregate metrics based on dimensions such as:
HTTP method
endpoint
status code
service
environment
instance
For example:
http_requests_total{status="500"}means:
Show request metrics where the HTTP status is 500.
What Is PromQL?
PromQL is one of the most important parts of Prometheus.
Think of it as the language you use to ask questions about your metrics.
For example:
How many requests exist?
http_requests_totalHow many requests returned HTTP 500?
http_requests_total{status="500"}What is the request rate?
rate(http_requests_total[5m])What is the total number of errors?
sum(http_errors_total)What is CPU usage?
A typical CPU query may look like:
rate(node_cpu_seconds_total[5m])PromQL can select time series and perform calculations and aggregations over them.
Setting Up Prometheus Locally
Let's create a simple local Prometheus setup.
The official getting-started workflow uses a YAML configuration file and a Prometheus server running locally.
A basic configuration looks like this:
global:
  scrape_interval: 15s

scrape_configs:
  - job_name: "prometheus"
    static_configs:
      - targets: ["localhost:9090"]
Here:
scrape_interval: 15smeans Prometheus attempts to scrape the configured targets every 15 seconds.
The scrape_configs section defines what Prometheus should monitor.
Prometheus itself exposes metrics on:
http://localhost:9090/metricsThe default web interface is available at:
http://localhost:9090The official documentation uses this self-monitoring setup as the first step when learning Prometheus.
Starting Prometheus
After downloading and extracting Prometheus, you can start it using:
./prometheus --config.file=prometheus.ymlOn Windows, the executable will be:
prometheus.exeAfter starting the server, open:
http://localhost:9090You can then use the Prometheus expression browser to query metrics.
For example:
promhttp_metric_handler_requests_totalThis is one of the metrics exposed by Prometheus itself.
Monitoring a Linux Server with Node Exporter
Prometheus becomes much more useful when monitoring external infrastructure.
For Linux systems, Node Exporter can expose operating-system and hardware metrics.
The architecture becomes:
Linux Server
     │
     ↓
Node Exporter
     │
     │ /metrics
     ↓
Prometheus
     │
     ↓
Grafana
Your Prometheus configuration can include another target:
scrape_configs:

  - job_name: "prometheus"
    static_configs:
      - targets: ["localhost:9090"]

  - job_name: "node_exporter"
    static_configs:
      - targets: ["localhost:9100"]
Now Prometheus can scrape both itself and Node Exporter.
This basic approach is also demonstrated in the Prometheus getting-started tutorial.
Prometheus and Kubernetes
Prometheus is especially popular in cloud-native environments because modern applications often consist of dynamically created containers and services.
A simplified Kubernetes monitoring architecture might look like:
              Kubernetes Cluster
                     │
        ┌────────────┼────────────┐
        │            │            │
     Node 1       Node 2       Node 3
        │            │            │
     Pods          Pods         Pods
        │            │            │
        └────────────┼────────────┘
                     │
                Prometheus
                     │
              ┌──────┴──────┐
              │             │
           Grafana      Alertmanager
Prometheus can use service discovery mechanisms to find monitoring targets dynamically, which is particularly useful in environments where workloads frequently change.
The Four Golden Signals
A useful framework for monitoring user-facing systems is the four golden signals:
1. Latency
How long does it take to serve a request?
Example:
Average API latency = 240ms2. Traffic
How much demand is the system receiving?
Example:
2,000 requests/sec3. Errors
How many requests are failing?
Example:
HTTP 5xx = 2.5%4. Saturation
How close is the system to its capacity?
Examples:
CPU = 85%
Memory = 92%
Disk = 88%
These signals provide a useful starting point for understanding system health. The Opensource.com Prometheus tutorial specifically discusses latency, traffic, errors, and saturation as the four golden signals, while its hands-on example focuses on traffic, errors, and latency.
Creating an Alert
Monitoring becomes much more useful when it can tell you about problems automatically.
For example, suppose your application has too many HTTP 500 errors.
You could define an alerting rule conceptually like:
groups:
  - name: application-alerts
    rules:

      - alert: HighErrorRate
        expr: rate(http_requests_total{status="500"}[5m]) > 5
        for: 5m

        labels:
          severity: critical

        annotations:
          summary: "High HTTP 500 error rate"
          description: "The application is returning too many server errors."
The idea is:
Metric
  ↓
PromQL condition
  ↓
Alert rule
  ↓
Prometheus
  ↓
Alertmanager
  ↓
Notification
Alertmanager then helps route and manage the resulting notifications.
Prometheus + Grafana
Prometheus has its own query interface and graphing capabilities.
However, many teams use Grafana to build richer dashboards from Prometheus data.
The relationship can be visualized as:
Applications
     ↓
Prometheus
     ↓
PromQL
     ↓
Grafana
     ↓
Dashboards
A dashboard might contain:
┌─────────────────────────────────────┐
│         APPLICATION HEALTH          │
├─────────────┬───────────┬───────────┤
│ Requests/s  │ Error %   │ Latency   │
│   2,450     │   0.4%    │  180ms    │
├─────────────┴───────────┴───────────┤
│                                     │
│       Request Rate Graph            │
│                                     │
├─────────────────────────────────────┤
│                                     │
│       CPU / Memory Graph            │
│                                     │
└─────────────────────────────────────┘
This gives developers and DevOps teams a visual overview of application health.
Prometheus Monitoring Example
Let's imagine we are monitoring an online shopping API.
We define these metrics:
http_requests_total
http_errors_total
http_request_duration_seconds
active_users
database_connections
We can then answer different questions.
How many requests are arriving?
rate(http_requests_total[5m])How many errors are occurring?
rate(http_errors_total[5m])How many users are currently active?
active_usersHow many database connections are open?
database_connectionsHow quickly are requests being processed?
For histogram-based latency metrics, PromQL can be used to calculate rates and latency distributions.
For example:
histogram_quantile(
  0.95,
  rate(http_request_duration_seconds_bucket[5m])
)
This can be used to estimate the 95th percentile request latency from a classic histogram.
Prometheus documents histogram querying and histogram_quantile() as a way to calculate quantiles from histogram data.
Prometheus vs Traditional Monitoring
Traditional monitoring might focus heavily on:
Server UP
Server DOWN
Modern application monitoring needs much more context:
Is the API slow?
Are errors increasing?
Which endpoint is failing?
Is traffic increasing?
Is the database overloaded?
Which service is consuming CPU?
Did latency change after deployment?
Prometheus allows engineers to collect and query detailed numerical metrics to answer these questions.
This makes it particularly useful for:
microservices
Kubernetes
containers
APIs
cloud-native applications
DevOps environments
SRE workflows
Advantages of Prometheus
Open Source
Prometheus is open source and has a large ecosystem.
Pull-Based Architecture
Prometheus actively scrapes configured endpoints rather than requiring every target to push metrics.
Powerful Query Language
PromQL provides powerful filtering, aggregation, and time-series calculations.
Strong Kubernetes Ecosystem
Prometheus is widely used alongside Kubernetes and cloud-native tooling.
Flexible Labels
Labels allow metrics to be segmented by dimensions such as service, instance, method, environment, or status.
Alerting
Prometheus can evaluate alerting rules and work with Alertmanager for notification management.
These characteristics are among the reasons Prometheus is commonly used in cloud-native monitoring environments.
Limitations of Prometheus
Prometheus is powerful, but it is not designed to solve every monitoring problem.
1. Long-Term Storage
A single Prometheus instance is not necessarily the ideal solution for storing very large quantities of metrics indefinitely.
For long-term or large-scale storage, organizations may use additional systems and remote-storage architectures.
2. High Cardinality
Labels are powerful, but creating excessive numbers of unique label combinations can create a very large number of time series.
For example, using highly unique values such as:
user_id
request_id
transaction_id
as labels can be problematic at scale.
3. Metrics Are Not Logs
Prometheus is primarily a metrics system.
If you need detailed event-by-event application logs, you need a logging system.
4. Metrics Are Not Traces
Metrics can tell you:
API latency = 2 secondsBut distributed tracing can help explain:
API
 ↓
Service A
 ↓
Service B
 ↓
Database
and identify where the latency occurred.
This is why modern observability platforms often combine:
Metrics + Logs + Tracesrather than relying on only one telemetry type.
GeeksforGeeks also notes limitations around long-term storage, single-node operation, and advanced visualization requiring complementary tooling.
Best Practices for Prometheus Monitoring
1. Monitor What Matters
Don't collect every possible metric simply because you can.
Start with metrics that answer important operational questions.
For example:
Traffic
Errors
Latency
Saturation
2. Use Meaningful Labels
Good:
service="payment"
environment="production"
status="500"
Be careful with extremely high-cardinality labels.
3. Use Counters for Events
For example:
http_requests_totalUse counters for values that accumulate.
4. Use Gauges for Current State
For example:
active_connections
memory_usage_bytes
5. Use Histograms for Latency
When you need to understand response-time distributions and latency objectives, histograms are often useful.
6. Create Useful Alerts
An alert should represent a condition that someone needs to investigate.
Avoid creating alerts for every small fluctuation.
Otherwise, teams can experience alert fatigue.
7. Build Dashboards Around Questions
Instead of creating a dashboard containing hundreds of metrics, organize it around questions such as:
Is the application healthy?

Is traffic increasing?

Are errors increasing?

Is latency getting worse?

Is infrastructure approaching capacity?
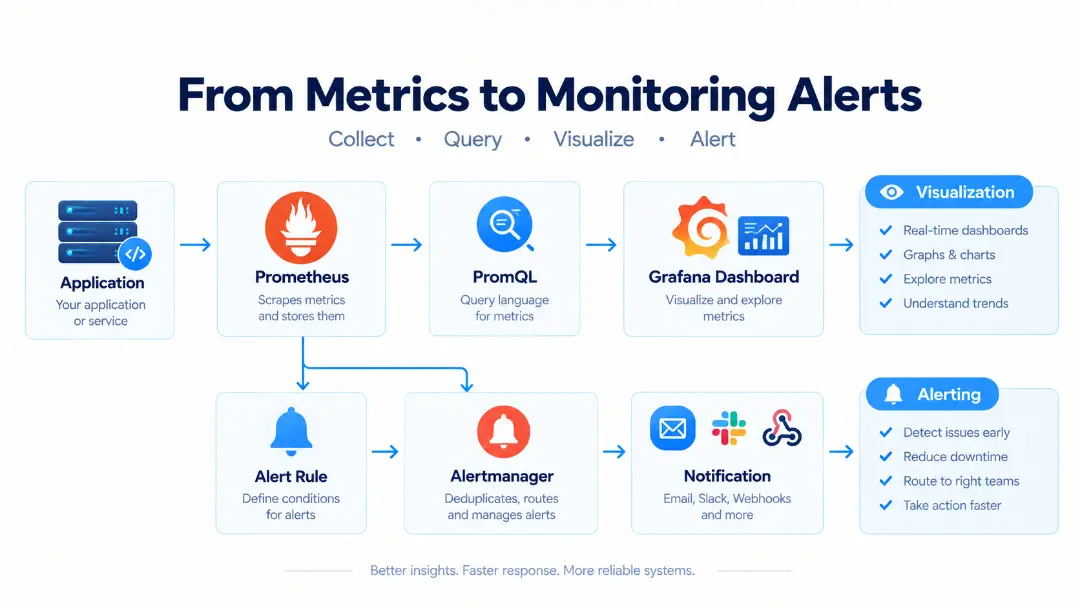
A Simple Mental Model
If you're new to Prometheus, remember this:
             YOUR APPLICATION
                    │
                    │ exposes metrics
                    ↓
                /metrics
                    │
                    ↓
               PROMETHEUS
                    │
          ┌─────────┴─────────┐
          │                   │
       PromQL             Alert Rules
          │                   │
          ↓                   ↓
       Grafana            Alertmanager
          │                   │
          ↓                   ↓
      Dashboards          Notifications
The entire system can be summarized as:
Expose → Scrape → Store → Query → Visualize → Alert
That is the core Prometheus workflow.
Final Thoughts
Prometheus is much more than a tool that displays CPU and memory graphs.
It provides a way to turn application and infrastructure behavior into measurable time-series data.
Once you understand:
Metrics
   ↓
Targets
   ↓
Scraping
   ↓
Time-Series Storage
   ↓
PromQL
   ↓
Dashboards
   ↓
Alerts
the architecture becomes much easier to understand.
For beginners entering DevOps, SRE, cloud engineering, or Kubernetes, Prometheus is an important monitoring technology to learn because it introduces several fundamental concepts used throughout modern observability.
Start small.
Monitor one application.
Expose a /metrics endpoint.
Configure one Prometheus target.
Run a few PromQL queries.
Create a simple dashboard.
Then add alerts.
Once these concepts are clear, you can gradually move toward monitoring larger Kubernetes and microservices environments.
In one sentence:
Prometheus helps you understand what your systems are doing by continuously collecting, storing, querying, and alerting on metrics over time.
Frequently Asked Questions - Prometheus Monitoring
1. What is Prometheus?
Prometheus is an open-source monitoring and alerting system used to collect, store, query, and analyze time-series metrics from applications, servers, containers, and cloud infrastructure.
2. How does Prometheus work?
Prometheus primarily follows a pull-based model. It periodically scrapes metrics from configured targets, usually through an HTTP /metrics endpoint, and stores the collected data as time-series metrics.
3. What is PromQL?
PromQL (Prometheus Query Language) is the query language used to retrieve, filter, aggregate, and analyze metrics stored in Prometheus.
4. What are Prometheus metrics?
Metrics are numerical measurements collected over time. Common examples include CPU usage, memory consumption, HTTP requests, error rates, request latency, and active connections.
5. What are the four main Prometheus metric types?
Prometheus supports four core metric types: Counter, Gauge, Histogram, and Summary. Counters generally increase, gauges can increase or decrease, while histograms and summaries are commonly used for observations such as request latency.
6. What is a Prometheus exporter?
An exporter collects metrics from a system that doesn't directly expose Prometheus-formatted metrics and makes those metrics available through an endpoint that Prometheus can scrape. Node Exporter, for example, exposes Linux system metrics.
7. What is the difference between Prometheus and Grafana?
Prometheus primarily collects and stores metrics and provides PromQL for querying them. Grafana is commonly used to turn those metrics into interactive dashboards and visualizations.
8. What is Alertmanager in Prometheus?
Alertmanager handles alerts generated by Prometheus. It can group, deduplicate, route, and send notifications through supported notification channels.
9. Can Prometheus monitor Kubernetes?
Yes. Prometheus is widely used for monitoring Kubernetes environments. It can collect metrics from Kubernetes components, nodes, containers, and applications running inside the cluster.
10. Is Prometheus suitable for application monitoring?
Yes. Applications can expose metrics such as request counts, error rates, response latency, and active connections. Prometheus can then scrape and analyze these metrics.
11. What are the four golden signals in monitoring?
The four commonly used golden signals are latency, traffic, errors, and saturation. They provide a useful starting point for understanding the health and performance of a service.
12. Is Prometheus a logging tool?
No. Prometheus is primarily a metrics monitoring system. Logs provide detailed event information, while metrics provide numerical measurements over time. In modern observability environments, metrics, logs, and traces are often used together.
13. What are some limitations of Prometheus?
Prometheus requires careful management of storage and metric cardinality at scale. Extremely high-cardinality labels can create large numbers of time series, and long-term storage may require additional systems or architectures.
14. Is Prometheus free to use?
Yes. Prometheus is an open-source project and can be deployed and used without purchasing a commercial Prometheus license.
15. Why should DevOps engineers learn Prometheus?
Prometheus introduces important monitoring and observability concepts and is commonly used with Kubernetes, containers, microservices, cloud infrastructure, DevOps, and SRE workflows.
Ready to go deeper?
Professional Training
Hands-on, mentor-led training aligned with industry certifications.
About the Author
Sharper every day
Daily tutorials, analysis, and career playbooks across all 12 Xcademia disciplines, straight to your inbox. No spam.