Grafana + Loki for Beginners: A Complete Guide to Logs, LogQL, Dashboards and Troubleshooting
Learn how Grafana and Loki work together to centralize application logs, query them with LogQL, build dashboards, create alerts, and troubleshoot modern applications.
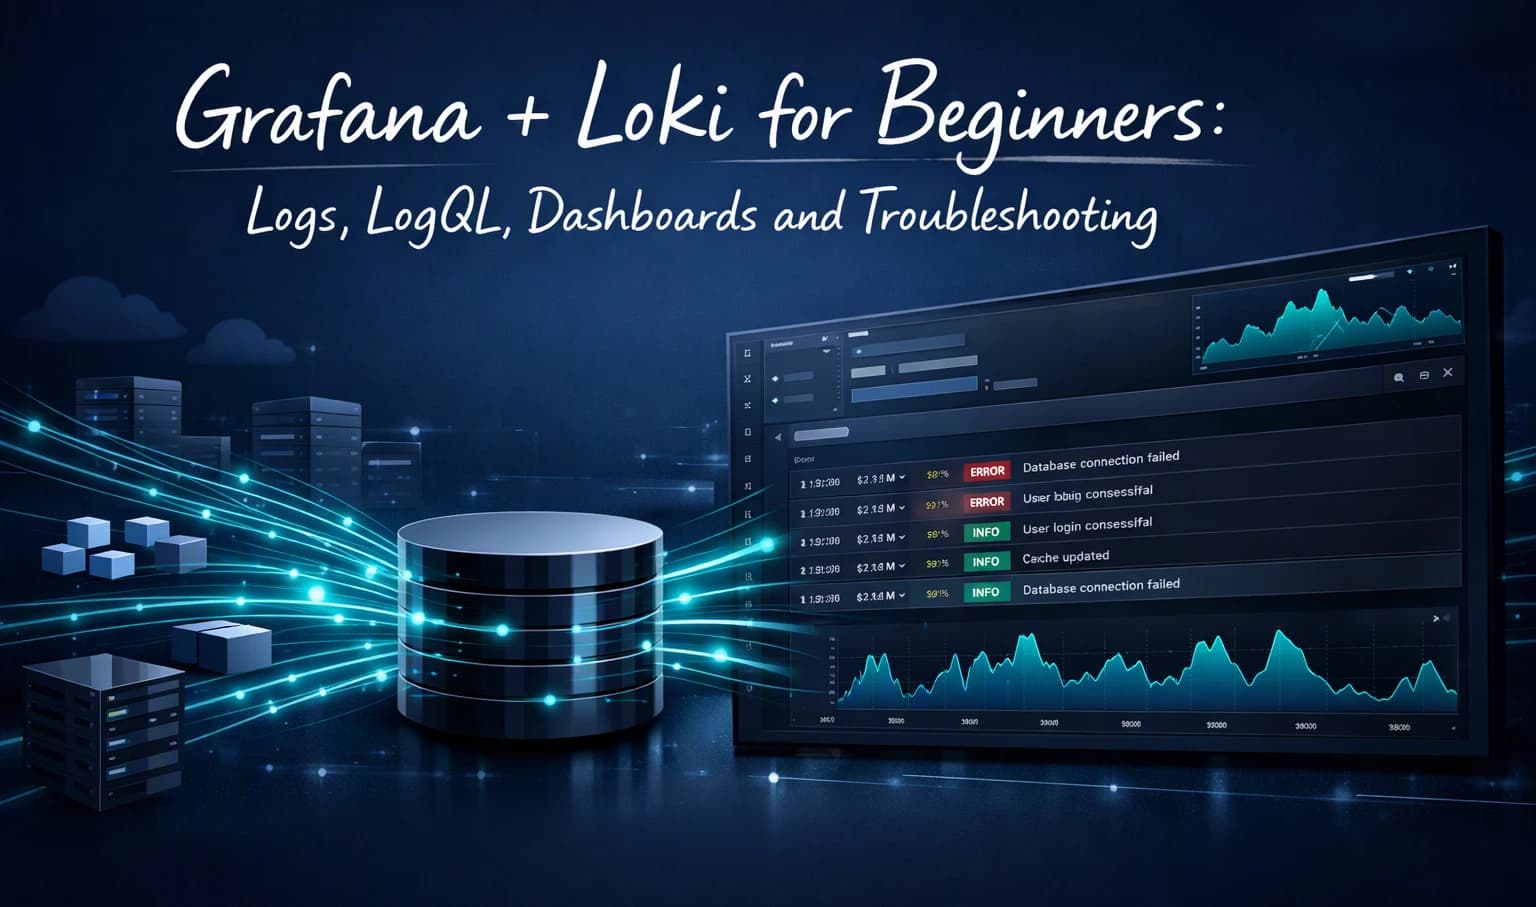
Modern applications generate thousands or even millions of log messages.
A web server may produce access logs. An application may generate error messages. Kubernetes creates container logs. Databases and infrastructure services also generate logs that can help engineers understand what happened when something goes wrong.
The challenge is not simply collecting these logs.
The real challenge is finding the right log at the right time.
This is where Grafana Loki becomes useful.
Loki is a log aggregation system designed to store and query logs efficiently. Unlike traditional logging systems that index the full contents of every log line, Loki primarily indexes metadata called labels and stores the log content in compressed chunks.
Grafana can connect directly to Loki and provide a visual interface for searching, filtering, exploring, and visualizing those logs.
In this guide, we will learn:
What Loki is
How Grafana and Loki work together
Grafana Loki architecture
What labels are
What LogQL is
Basic LogQL queries
How to add Loki to Grafana
How logs can be turned into metrics
How to build useful log dashboards
How to create log-based alerts
How Grafana + Loki helps with troubleshooting
Grafana + Loki vs Grafana + Prometheus
What Is Grafana Loki?
Grafana Loki is a log aggregation system created by Grafana Labs.
In simple terms:
Loki collects and stores logs so that you can search and analyze them later.
For example, an application might produce logs like:
2026-09-22 10:15:21 INFO User login successful
2026-09-22 10:15:24 INFO API request received
2026-09-22 10:15:27 ERROR Database connection failed
2026-09-22 10:15:30 WARN Retry attempt 1
Instead of manually opening log files on individual servers, Loki can centralize these logs.
You can then use Grafana to search them.
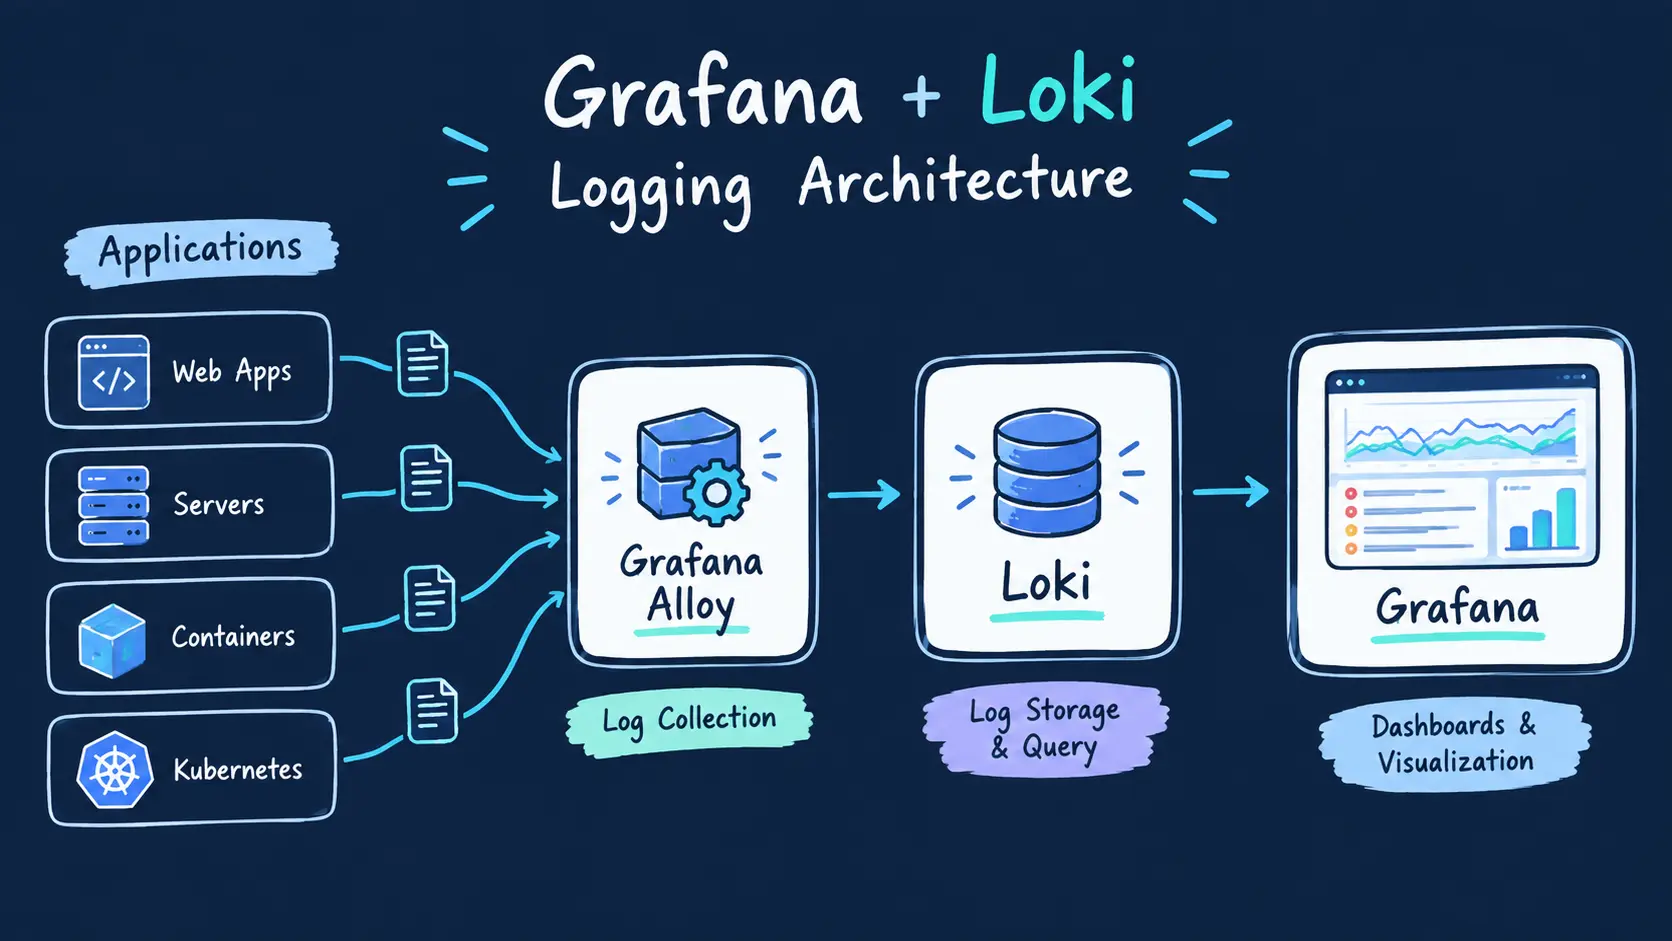
A simplified architecture looks like this:
Application
     |
     | Logs
     ↓
Grafana Alloy
     |
     | Push
     ↓
   Loki
     |
     | LogQL
     ↓
  Grafana
     |
     ↓
Dashboards / Explore / Alerts
Grafana's current Loki documentation describes Alloy as a component that can collect logs and send them to Loki, while Grafana provides the interface for querying and visualizing them.
Why Do We Need Loki?
Imagine an application running across 20 servers.
Each server generates logs.
Without centralized logging, an engineer might need to connect to different machines and search individual log files.
That becomes difficult very quickly.
With Loki:
Server 1 ─┐
Server 2 ─┤
Server 3 ─┤
Server 4 ─┤──→ Loki ──→ Grafana
Server 5 ─┤
Server 6 ─┘
Logs can be queried from one place.
This becomes particularly useful when applications run across:
Kubernetes
Docker
Cloud servers
Microservices
Multiple application instances
Distributed systems
Grafana vs Loki
Beginners often confuse Grafana and Loki.
They perform different jobs.
Tool | Primary Purpose |
|---|---|
Grafana | Visualization and observability |
Loki | Log aggregation and querying |
Prometheus | Metrics collection and storage |
LogQL | Query language for Loki |
Grafana Alloy | Collects and forwards telemetry |
A simple way to remember this is:
Prometheus → Metrics

Loki → Logs

Grafana → Visualizes and explores both
Loki is inspired by Prometheus and uses a similar label-based approach, but Loki focuses on logs rather than time-series metrics.
Grafana + Loki Architecture
A basic Grafana Loki architecture contains three important parts:
Application
     |
     ↓
Grafana Alloy
     |
     ↓
    Loki
     |
     ↓
  Grafana
1. Application
Applications generate logs.
For example:
INFO Server started
INFO Request received
ERROR Database timeout
WARN Retry attempt
2. Grafana Alloy
Alloy can collect logs from applications, containers, and infrastructure and forward them to Loki.
3. Loki
Loki receives, stores, and processes the logs.
Loki does not index the entire content of every log line. Instead, it indexes metadata associated with log streams and stores the actual log data in compressed chunks.
4. Grafana
Grafana connects to Loki as a data source.
You can then use Grafana to:
Search logs
Filter logs
Build visualizations
Create dashboards
Explore logs
Create alerts
Grafana has built-in Loki support, so a separate Grafana plugin is not required.
What Are Loki Labels?
Labels are one of the most important concepts in Loki.
A label provides metadata about a log stream.
For example:
{job="api", environment="production"}This tells Loki that the logs belong to the api job running in the production environment.
Another example:
{service="payment", environment="production"}The labels help Loki identify which log streams should be searched.
Important rule
Avoid putting highly unique values into labels.
For example, using:
{user_id="123456"}as a label can create extremely high cardinality.
Instead, values such as:
{service="api", environment="production"}are generally more suitable labels.
Loki's documentation emphasizes that choosing good, low-cardinality labels is important for efficient query execution.
What Is LogQL?
If Prometheus uses PromQL, Loki uses LogQL.
LogQL stands for Log Query Language.
It allows you to search, filter, parse, and analyze logs stored in Loki.
For example:
{job="api"}This selects logs belonging to the api job.
You can also filter log content.
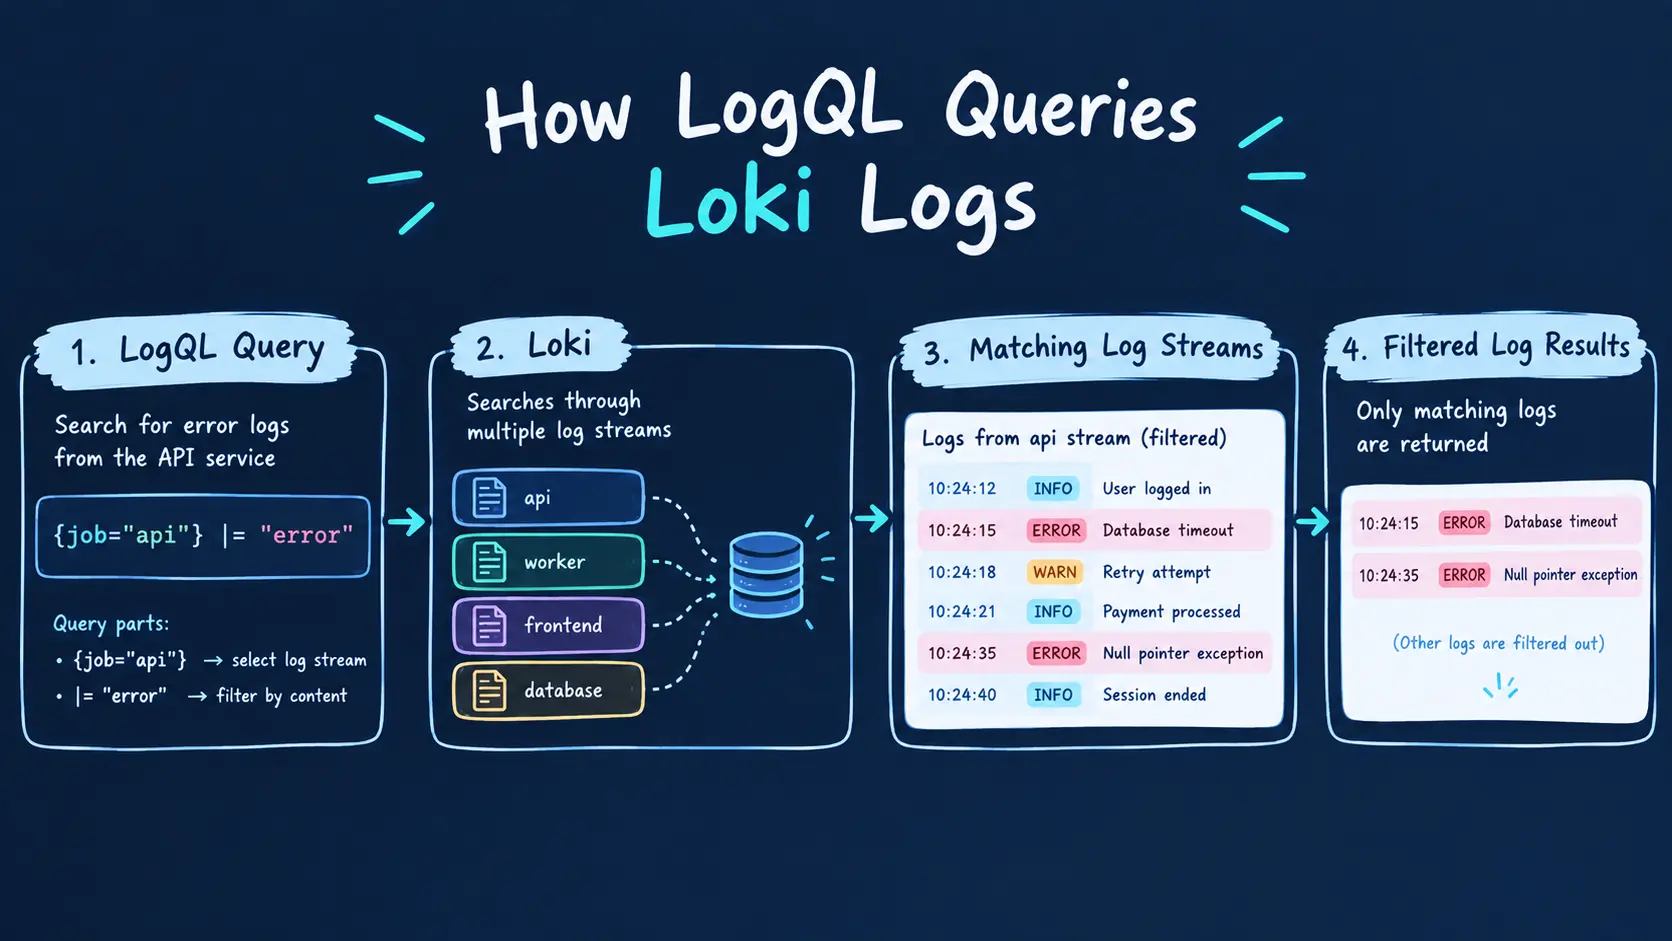
{job="api"} |= "error"This searches the api logs for lines containing the word error.
Another example:
{job="api"} |= "timeout"This searches for timeout messages.
LogQL is intentionally familiar to people who already know PromQL, while providing operations specifically designed for log data.
Basic LogQL Examples
Here are some useful beginner queries.
Select all logs
{job="api"}Search for errors
{job="api"} |= "error"Search for warnings
{job="api"} |= "WARN"Exclude a word
{job="api"} != "debug"Search for multiple conditions
{job="api"} |= "error" |= "database"This can help find log entries containing both terms.
LogQL and Structured Logs
Modern applications often produce structured logs such as JSON.
For example:
{
  "level": "error",
  "service": "payment",
  "message": "Database connection failed",
  "status": 500
}
Structured logs make it easier to extract fields for analysis.
A LogQL pipeline can process the log:
{service="payment"} | jsonYou can then filter based on extracted fields.
For example:
{service="payment"} | json | status >= 500This can help identify server-side errors.
Grafana Explore With Loki
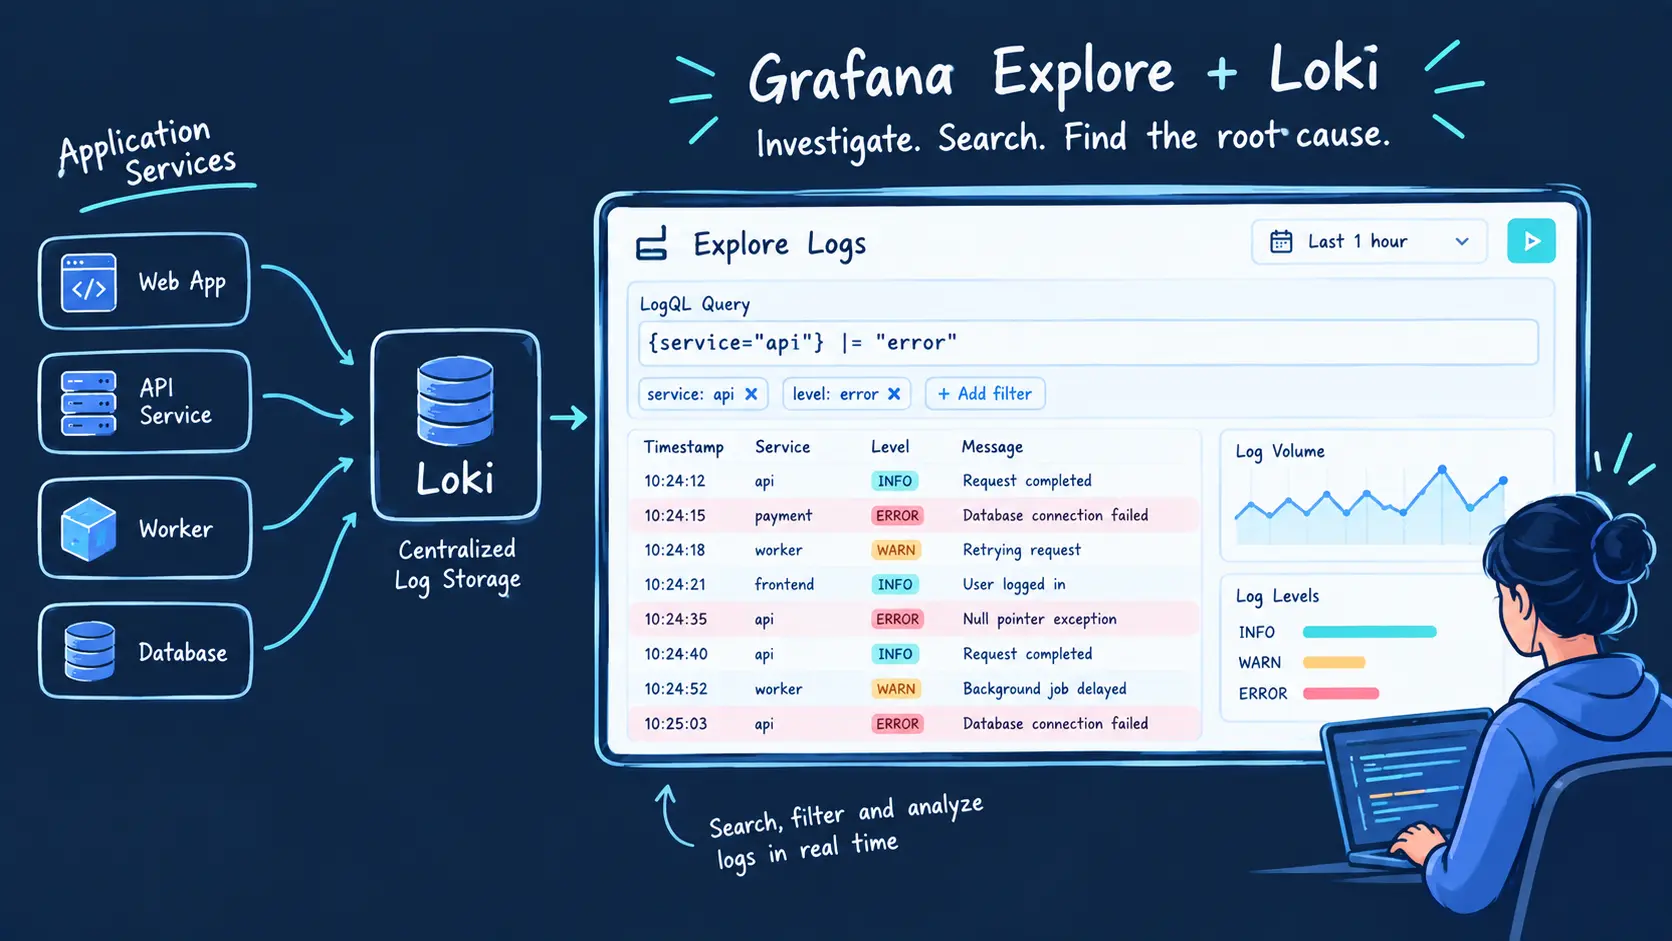
One of the easiest ways to work with Loki is through Grafana Explore.
You do not need to create a dashboard first.
You can open Explore, select Loki as the data source, and run a LogQL query.
For example:
{job="api"} |= "error"Grafana will display matching log entries.
This is useful when troubleshooting an incident.
For example:
Users report slow application
          ↓
Check metrics
          ↓
Response time increased
          ↓
Open Grafana Explore
          ↓
Search Loki logs
          ↓
Find database timeout
          ↓
Investigate database
Grafana's Loki integration supports Explore, live log tailing, visualizations, annotations, and alerting.
Metrics vs Logs
This is where your Grafana + Prometheus article and your new Grafana + Loki article can work together.
Suppose your application suddenly becomes slow.
Prometheus might show:
Request latency: 2.8 seconds
Error rate: 12%
This tells you something is wrong.
Loki might show:
ERROR Database connection timeout
ERROR Connection pool exhausted
This helps explain what happened.
So:
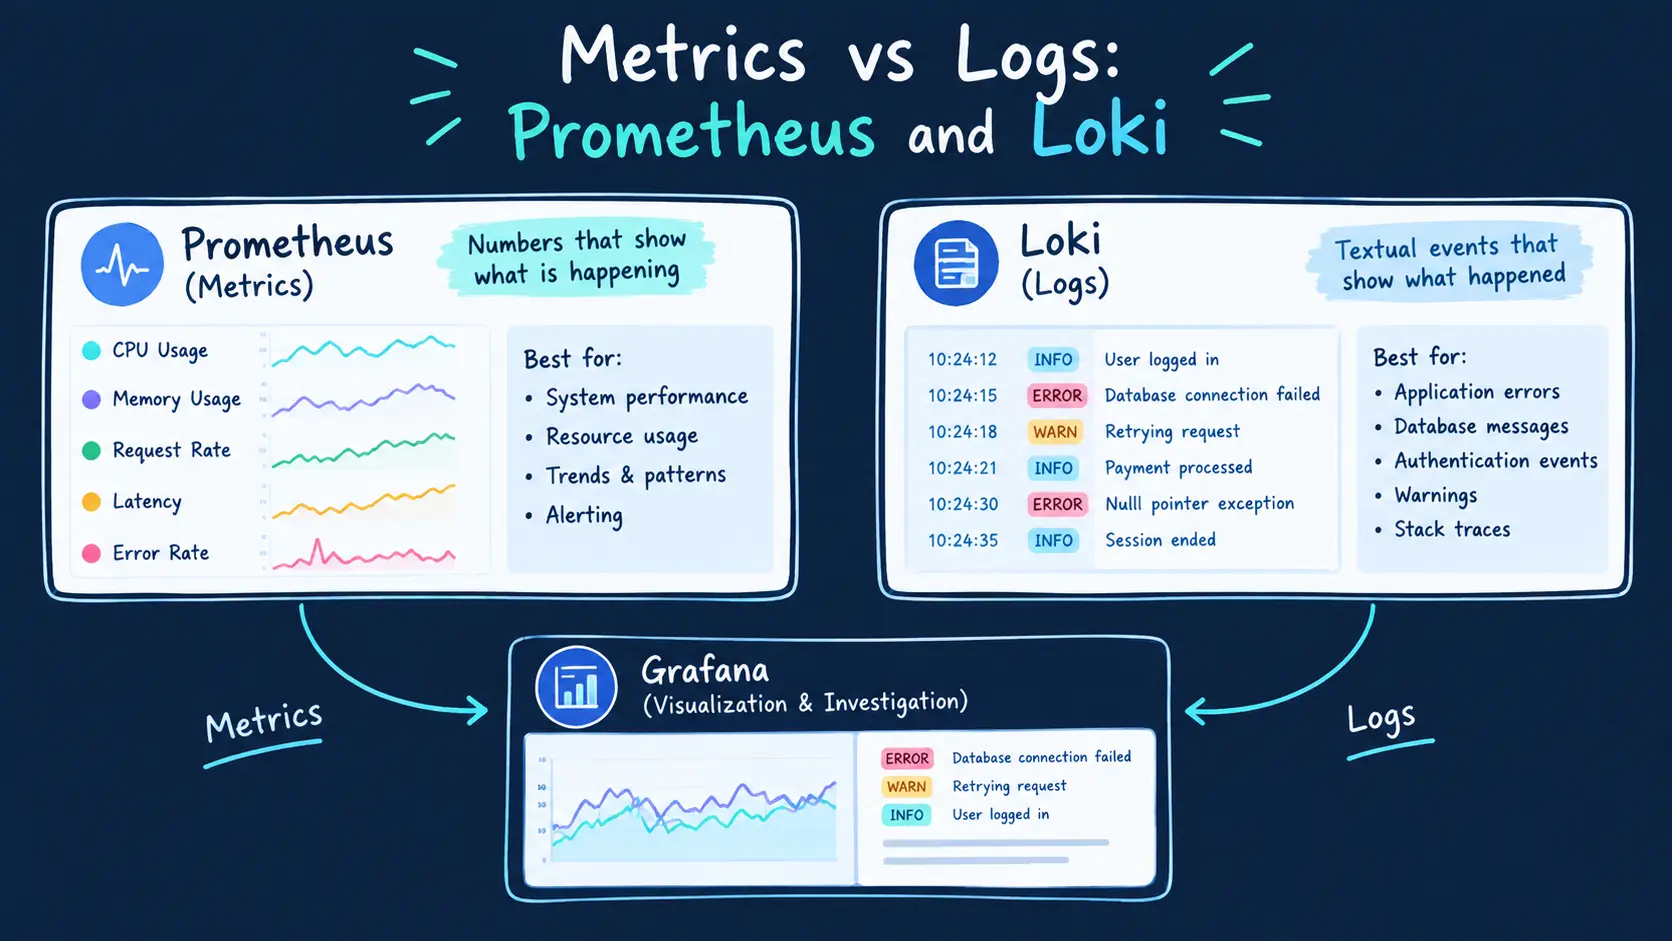
Metrics → What is happening?

Logs → What happened?

Grafana → Where can I investigate both?
This is a very useful concept for beginners.
Your existing article already introduces this relationship, so the new article can go deeper into the logging side rather than repeating the Prometheus material.
Grafana + Prometheus + Loki
You can also use Prometheus and Loki together.
A modern observability setup can look like:
                    ┌──→ Prometheus
                    │       ↓
Application ────────┤     Metrics
                    │
                    └──→ Loki
                            ↓
                          Logs
                            │
                            ↓
                         Grafana
Grafana provides a common interface for exploring both data sources.
For example:
Grafana Dashboard

CPU Usage              78%
Memory Usage           71%
Request Rate           420 req/s
Error Rate             5.2%

Recent Logs
--------------------------------
ERROR Database timeout
ERROR API request failed
WARN Connection retry
This gives engineers both the high-level signal and the detailed evidence needed during troubleshooting.
Grafana's documentation specifically supports using Loki alongside metrics sources and correlating logs with metrics and traces.
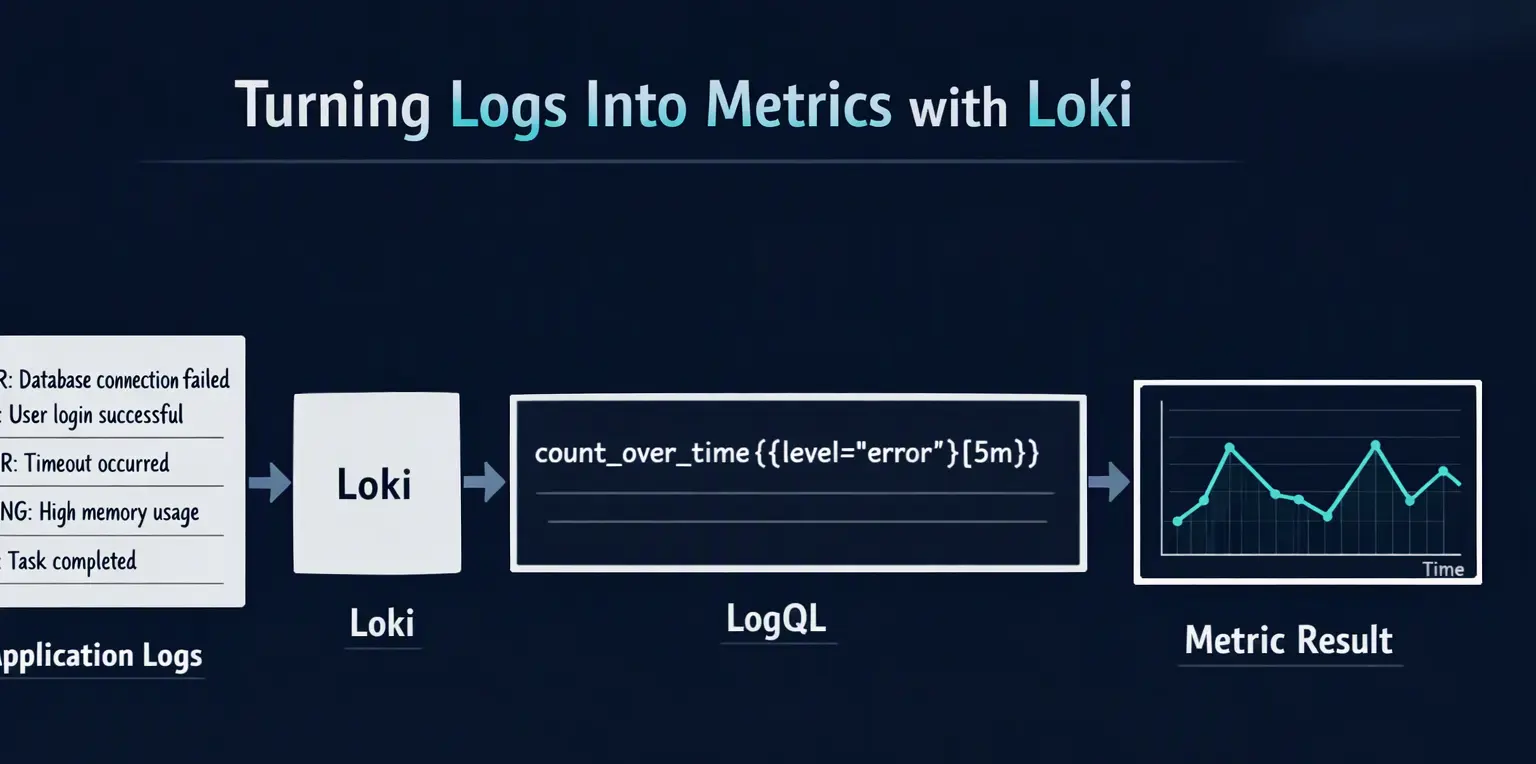
Turning Logs Into Metrics
One powerful feature of Loki is that LogQL can generate metrics from log data.
For example, suppose you want to count errors.
A query can use:
count_over_time(
  {job="api"} |= "error" [5m]
)
This can help answer:
How many error messages appeared during the last five minutes?
You can then visualize the result in Grafana.
Loki also supports recording rules that produce Prometheus-style metrics from log entries.
Creating a Log Monitoring Dashboard
A useful Grafana + Loki dashboard might include:
Panel 1: Total Logs
Shows the number of log entries over time.
Panel 2: Error Logs
Displays the number of errors.
Panel 3: Warning Logs
Tracks warning activity.
Panel 4: Application Logs
Displays recent log messages.
Panel 5: Errors by Service
Shows which services are generating the most errors.
Panel 6: Error Trend
Shows whether errors are increasing or decreasing.
For example:
------------------------------------------------
             APPLICATION LOG MONITORING
------------------------------------------------

Total Logs       Errors       Warnings
  48,921           342           781

------------------------------------------------
Errors Over Time
       /\              /\
      /  \      /\    /  \
_____/    \____/  \__/    \____

------------------------------------------------
Recent Errors

10:21:42  payment   Database timeout
10:22:01  orders    API request failed
10:22:15  payment   Connection refused
------------------------------------------------
The goal is not to create hundreds of panels.
The goal is to make important operational information easy to understand.
Log-Based Alerting
Logs can also be used for alerting.
Imagine your application starts producing a large number of authentication failures.
You could monitor matching log entries and create an alert.
For example:
sum(
  count_over_time(
    {service="auth"} |= "login failed" [5m]
  )
)
If the number crosses a defined threshold, an alert can be triggered.
Loki supports alerting and recording rules, while Grafana Alerting can also query Loki data.
This can be useful for detecting:
Repeated application errors
Authentication failures
Database failures
Service crashes
Unexpected application events
Loki in Kubernetes
Kubernetes environments can generate a large amount of log data.
For example:
Kubernetes Cluster
       |
       ├── frontend pod
       ├── backend pod
       ├── payment pod
       ├── database pod
       └── worker pod
              |
              ↓
        Grafana Alloy
              |
              ↓
             Loki
              |
              ↓
           Grafana
You can then search logs based on metadata such as:
namespace
pod
container
application
environment
This makes Loki particularly useful for troubleshooting containerized applications.
Grafana's Loki project documentation identifies Kubernetes pod logs as a common use case.
Loki vs Traditional Logging Systems
A major difference between Loki and traditional full-text log indexing systems is how log data is indexed.
A simplified comparison:
Feature | Loki | Traditional Full-Text Logging |
|---|---|---|
Primary purpose | Log aggregation | Log aggregation |
Full log indexing | No | Often yes |
Metadata labels | Yes | Varies |
Query language | LogQL | Depends on platform |
Grafana integration | Native | Depends |
Storage approach | Compressed log chunks | Varies |
Prometheus-style labels | Yes | Usually different |
Loki's approach of indexing metadata rather than the complete contents of every log line is one of its defining characteristics.
Grafana Loki Best Practices
If you are starting with Loki, keep these principles in mind.
1. Keep labels meaningful
Use labels such as:
service
environment
namespace
cluster
Avoid unnecessarily high-cardinality labels.
2. Do not turn every field into a label
Not every piece of information needs to be indexed.
3. Use structured logs
JSON logs can make parsing and filtering easier.
4. Create useful dashboards
Focus on questions engineers actually need to answer.
5. Combine logs and metrics
Metrics can identify an issue while logs can provide additional context.
6. Monitor Loki itself
Loki exposes its own metrics through a /metrics endpoint, which can be collected using Prometheus or another compatible metrics backend.
Grafana + Loki: A Simple Real-World Example
Imagine an e-commerce application.
A customer reports:
"The checkout page is not working."
First, check Prometheus:
HTTP 500 errors ↑
Request latency ↑
Something is clearly wrong.
Now open Grafana Explore and query Loki:
{service="checkout"} |= "error"You discover:
ERROR Payment database connection timeoutYou then filter further:
{service="checkout"} |= "database"Now you can investigate the database connection problem.
This is the real value of combining metrics and logs.
Prometheus
    ↓
Detects problem

Grafana
    ↓
Investigate

Loki
    ↓
Finds relevant logs

Engineer
    ↓
Identifies root cause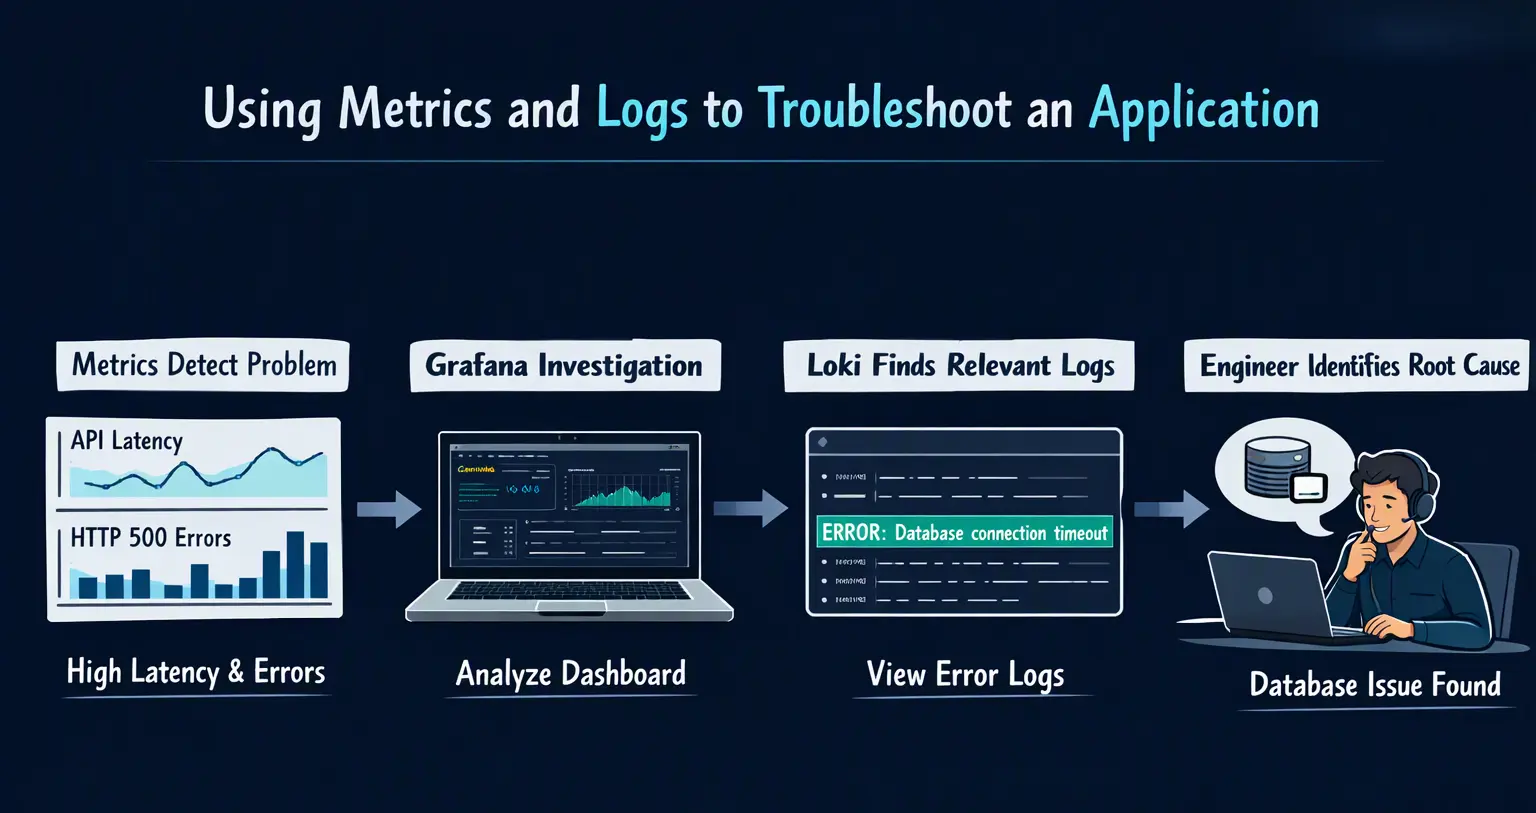
Grafana + Loki vs Grafana + Prometheus
These two setups are complementary rather than replacements for one another.
Grafana + Prometheus | Grafana + Loki |
|---|---|
Metrics | Logs |
PromQL | LogQL |
CPU usage | Application errors |
Memory usage | Database messages |
Request rate | Authentication events |
Latency | Stack traces |
Error rate | Detailed events |
Time-series analysis | Log investigation |
The most useful production environments often use both.
                 Grafana
                /       \
               /         \
        Prometheus       Loki
             ↓             ↓
          Metrics         Logs
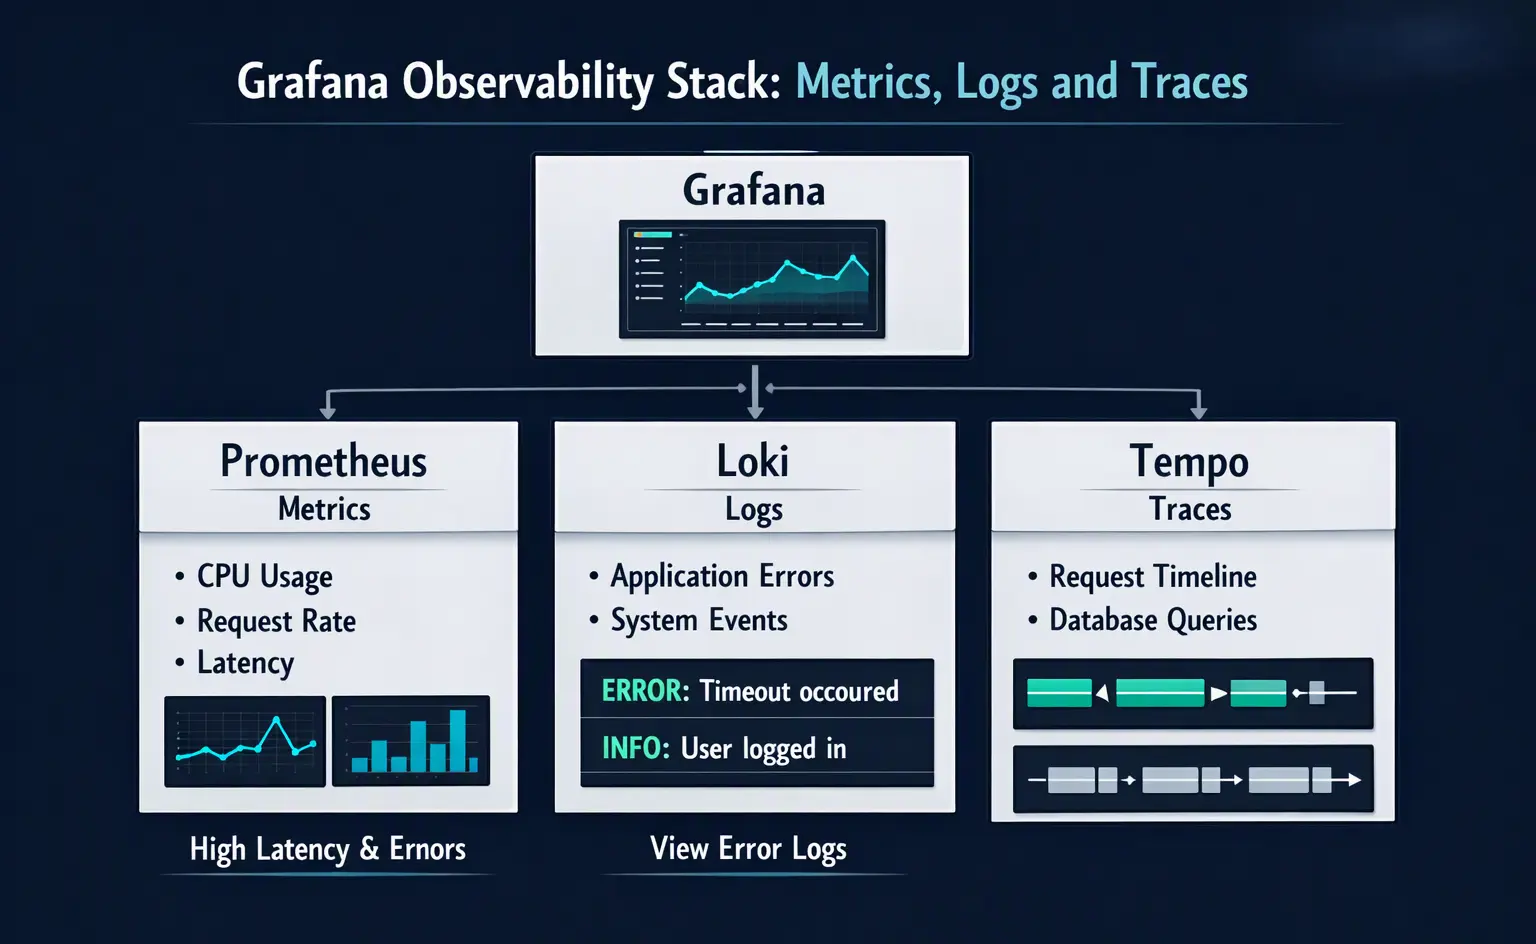
Grafana Loki and the Observability Stack
Grafana and Loki can also become part of a broader observability architecture.
A common conceptual stack is:
             Grafana
          /     |      \
         /      |       \
 Prometheus    Loki     Tempo
     ↓           ↓        ↓
  Metrics      Logs     Traces
This gives engineers multiple perspectives on the same application.
For example:
Metrics → API latency increased

Logs → Database timeout detected

Traces → Slow database operation identified
Together, these signals can make troubleshooting distributed systems much easier.
Grafana's ecosystem is designed to correlate logs, metrics, and traces across observability data sources.
Final Thoughts
Grafana and Loki provide a practical way to centralize, search, visualize, and monitor application logs.
The basic architecture is straightforward:
Applications
     ↓
Grafana Alloy
     ↓
    Loki
     ↓
  Grafana
     ↓
Dashboards / Explore / Alerts
The most important concepts to remember are:
Loki stores and queries logs
Grafana visualizes and explores them
Alloy can collect and forward logs
LogQL is used to query Loki
Labels identify log streams
Grafana Explore is useful for troubleshooting
Logs can be converted into useful metrics
Loki can work alongside Prometheus
The bigger idea is observability.
Prometheus helps you understand what is happening. Loki helps you investigate what happened. Grafana gives you a place to explore both.
Ready to go deeper?
Professional Training
Hands-on, mentor-led training aligned with industry certifications.
About the Author
Sharper every day
Daily tutorials, analysis, and career playbooks across all 12 Xcademia disciplines, straight to your inbox. No spam.