Grafana for Beginners: A Complete Guide to Monitoring, Dashboards, Metrics and Alerts
Grafana is one of the most popular tools for visualizing monitoring data. In this beginner-friendly guide, learn what Grafana is, how dashboards and data sources work, how Grafana connects with Prometheus, and how to create your first monitoring dashboard.
Modern applications generate a huge amount of technical data.
Servers produce CPU and memory metrics. Applications generate request and error data. Databases expose performance statistics. Containers and Kubernetes clusters continuously produce telemetry.
But collecting all this data is only part of the problem.
You also need a simple way to understand it.
This is where Grafana comes in.
Grafana is an open-source visualization and observability platform that allows you to connect data sources, query data, build dashboards, explore metrics and logs, and create alerts. Grafana's official beginner tutorial focuses on exploring metrics and logs, creating dashboards, adding annotations, and configuring alerts.
In this guide, we will learn Grafana from the beginning using simple examples.
What Is Grafana?
Grafana is a platform for querying, visualizing, monitoring, and alerting on data.
In simple words:
Grafana turns monitoring data into visual information that humans can understand quickly.
For example, imagine you are running a web application.
You may want to know:
How much CPU is the server using?
How much memory is available?
How many requests are reaching the application?
How many requests are failing?
How long are API requests taking?
Is traffic increasing?
Are there errors in the application logs?
Did an issue start after a deployment?
Instead of checking these values individually, Grafana can display them together in dashboards.
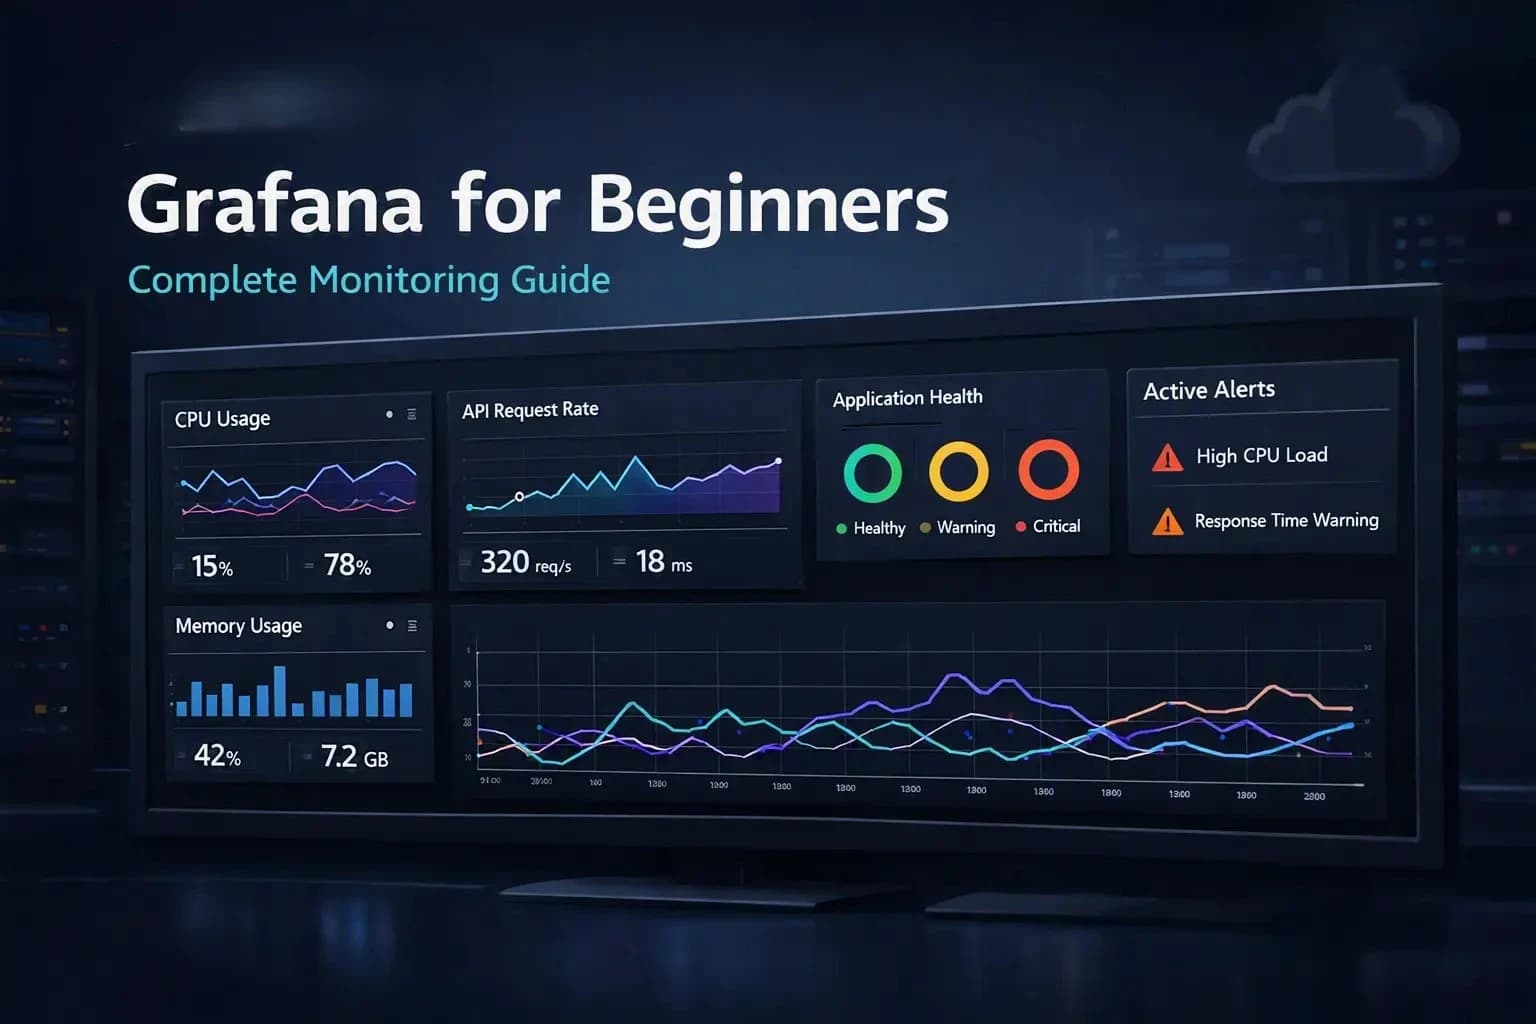
A dashboard could look like this:
-------------------------------------------------
|           APPLICATION MONITORING              |
-------------------------------------------------
| CPU Usage     | Memory Usage | Request Rate   |
|     62%       |     71%      |  245 req/sec   |
-------------------------------------------------
|              API Response Time                |
|       ────────────────────────────            |
|       120ms  150ms  180ms  135ms              |
-------------------------------------------------
| Errors       | Active Users | Database Health |
|     3        |     1,250    |      Healthy    |
-------------------------------------------------
This gives an engineer a quick overview of what is happening.
Grafana itself does not need to be the system that stores all your monitoring data. Instead, it connects to data sources and queries them for information to visualize. Grafana supports many different data sources, including monitoring systems, databases, and log systems.
Why Is Grafana Important?
Imagine having thousands of monitoring values but no easy way to understand them.
Raw data might look like:
cpu_usage = 67.82
memory_usage = 72.41
requests_total = 182938
errors_total = 124
This information is useful, but it is difficult to understand at a glance.
Grafana can transform it into:
Line charts
Bar charts
Stat panels
Gauges
Tables
Heatmaps
Time-series visualizations
Logs
Alerts
This makes monitoring easier for developers, DevOps engineers, SREs, cloud engineers, and system administrators.
Grafana is particularly useful when you need to understand how a system changes over time.
For example:
CPU Usage

100% |                         /
 80% |                  _____/
 60% |        __________/
 40% |_______/
 20% |
     +---------------------------->
              Time
A graph immediately shows that CPU usage is increasing.
That is much easier to understand than looking at hundreds of individual numbers.
How Does Grafana Work?
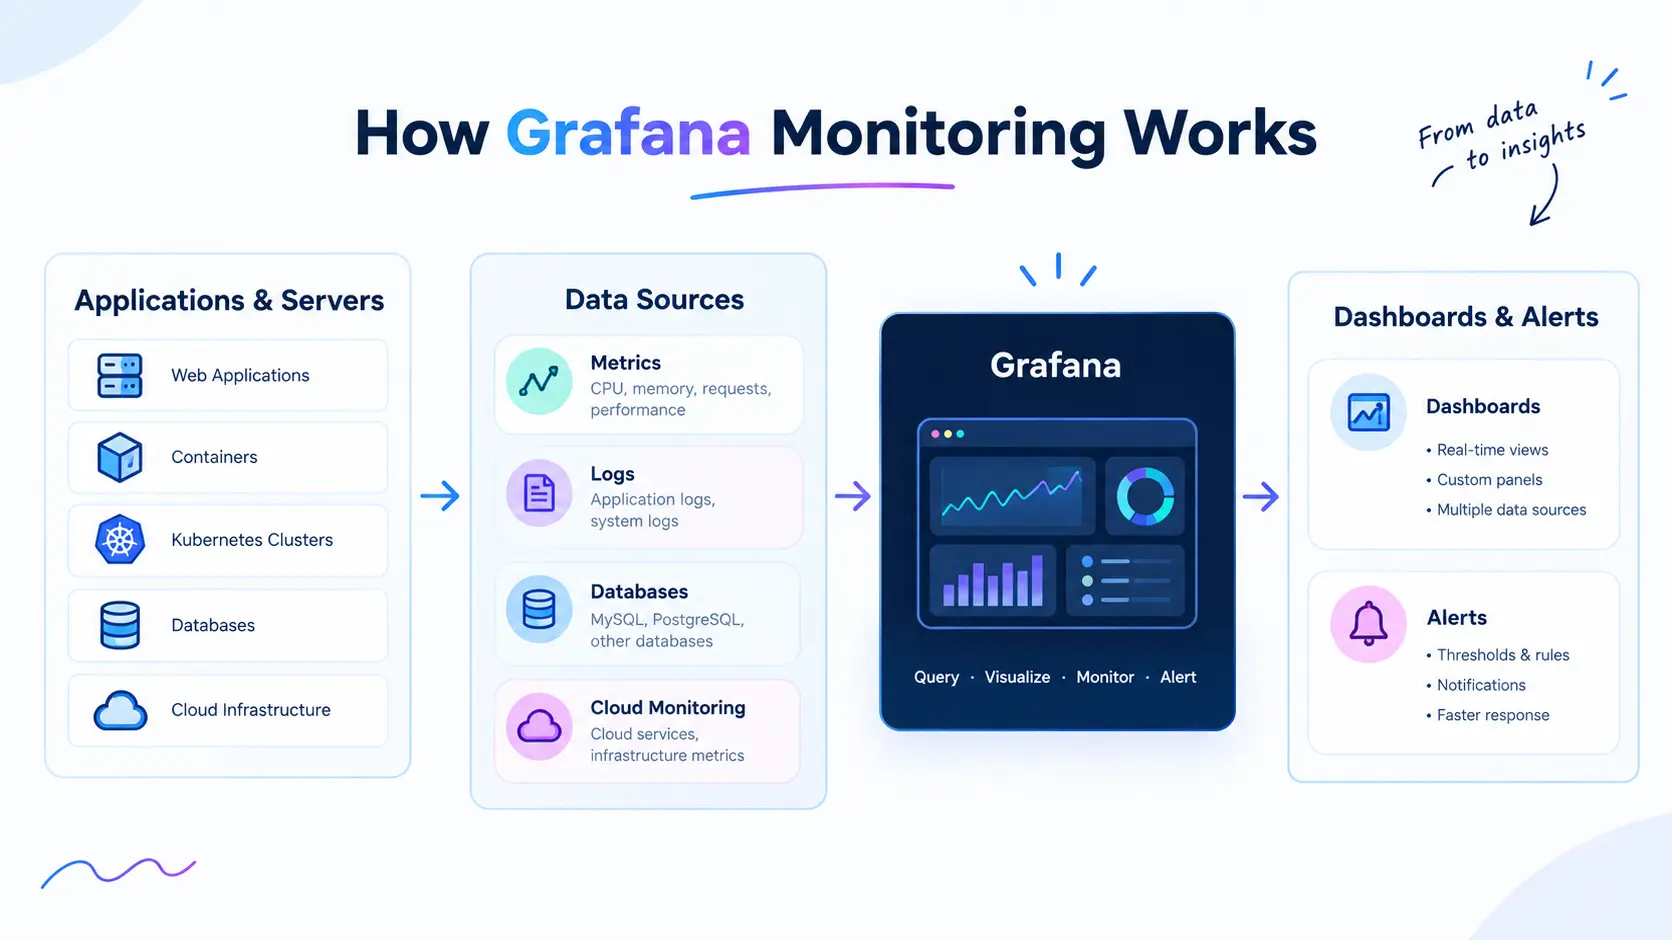
A simple Grafana workflow looks like this:
Application / Server
        ↓
Monitoring or Data System
        ↓
   Grafana Data Source
        ↓
      Grafana
        ↓
 Dashboard / Visualization
        ↓
      Alert
For example, a common monitoring setup is:
Application
     ↓
Prometheus
     ↓
Grafana
     |
     +------> Dashboard
     |
     +------> Alert
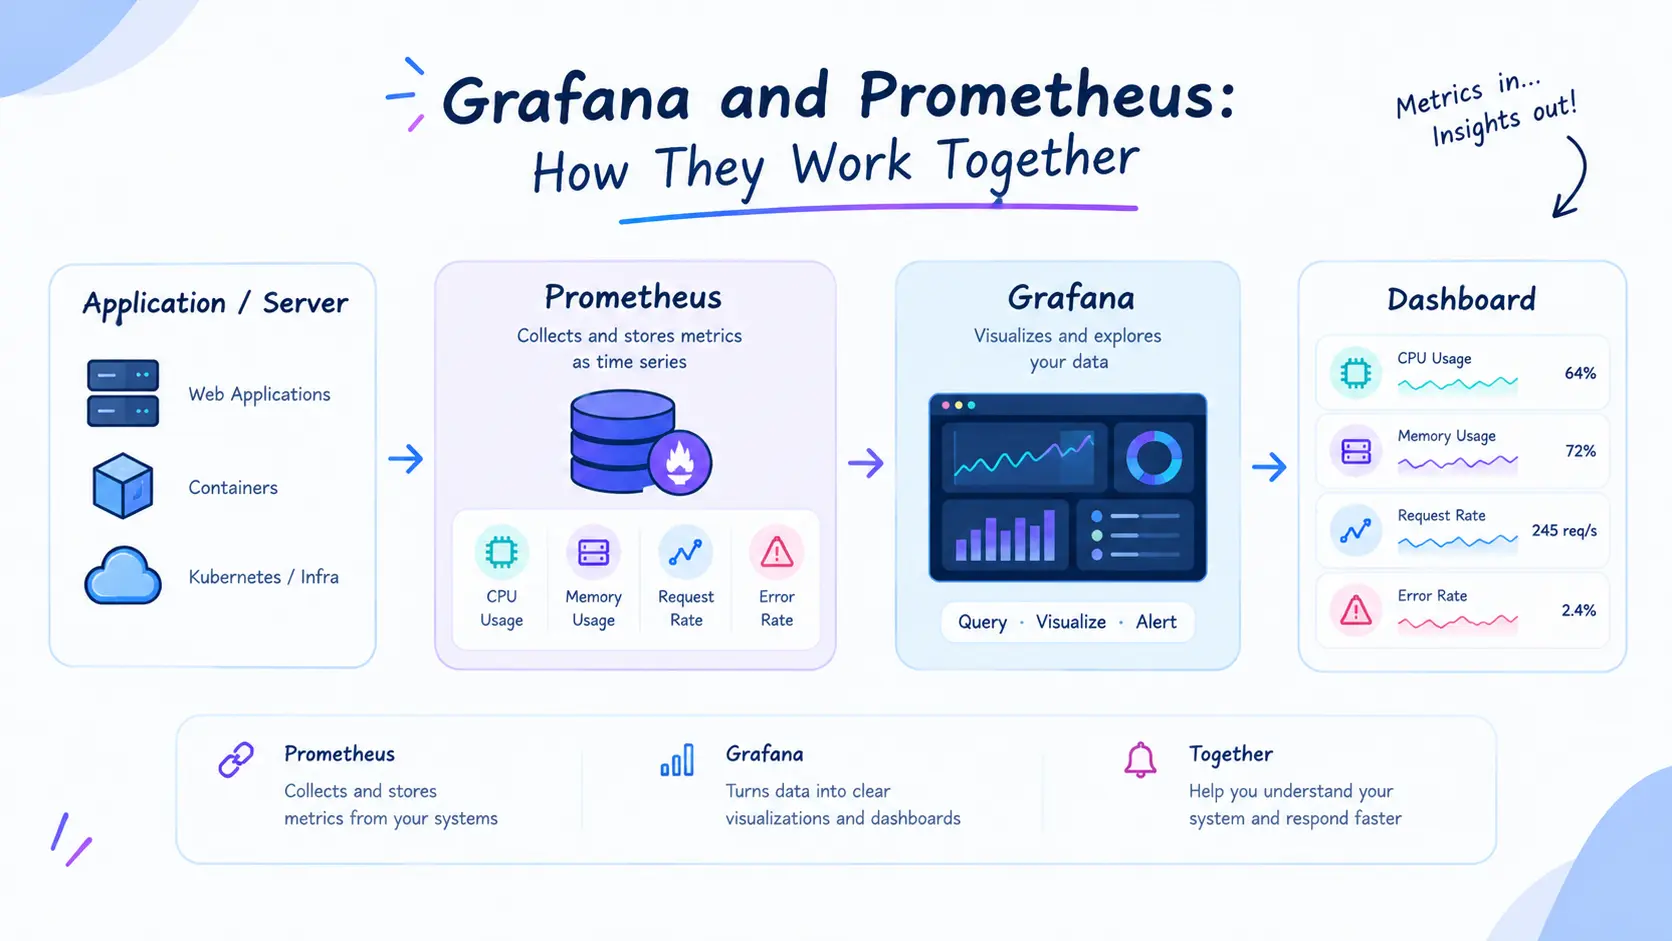
Prometheus collects and stores time-series metrics, while Grafana can query and visualize those metrics. The official Grafana fundamentals tutorial uses Prometheus as a configured data source and demonstrates querying it with PromQL.
Grafana vs Prometheus
Beginners often confuse Grafana and Prometheus.
They are related, but they do different jobs.
Tool | Main Purpose |
|---|---|
Prometheus | Collects and stores metrics |
Grafana | Visualizes and explores data |
Loki | Stores and queries logs |
Alertmanager | Handles Prometheus alerts |
A simple way to remember this is:
Prometheus = metrics
Grafana = visualization
For example, Prometheus might store:
http_requests_total
cpu_usage
memory_usage
api_errors_total
Grafana can then query those metrics and display them as graphs and dashboards.
Grafana's official tutorial demonstrates this workflow by querying Prometheus using PromQL and displaying the results in Grafana.
What Is a Grafana Data Source?
A data source is where Grafana gets the information it displays.
Think of Grafana as a TV screen.
The TV displays information, but it does not create the news.
Similarly, Grafana displays your data, while the data source provides it.
Examples of data sources include:
Prometheus
Loki
MySQL
PostgreSQL
Elasticsearch
InfluxDB
Cloud monitoring systems
Other supported databases and observability platforms
For example:
Prometheus ---> Metrics
Loki       ---> Logs
MySQL      ---> Database data
PostgreSQL ---> Database data
Grafana's documentation demonstrates adding Prometheus for metrics and Loki for logs.
What Are Grafana Dashboards?
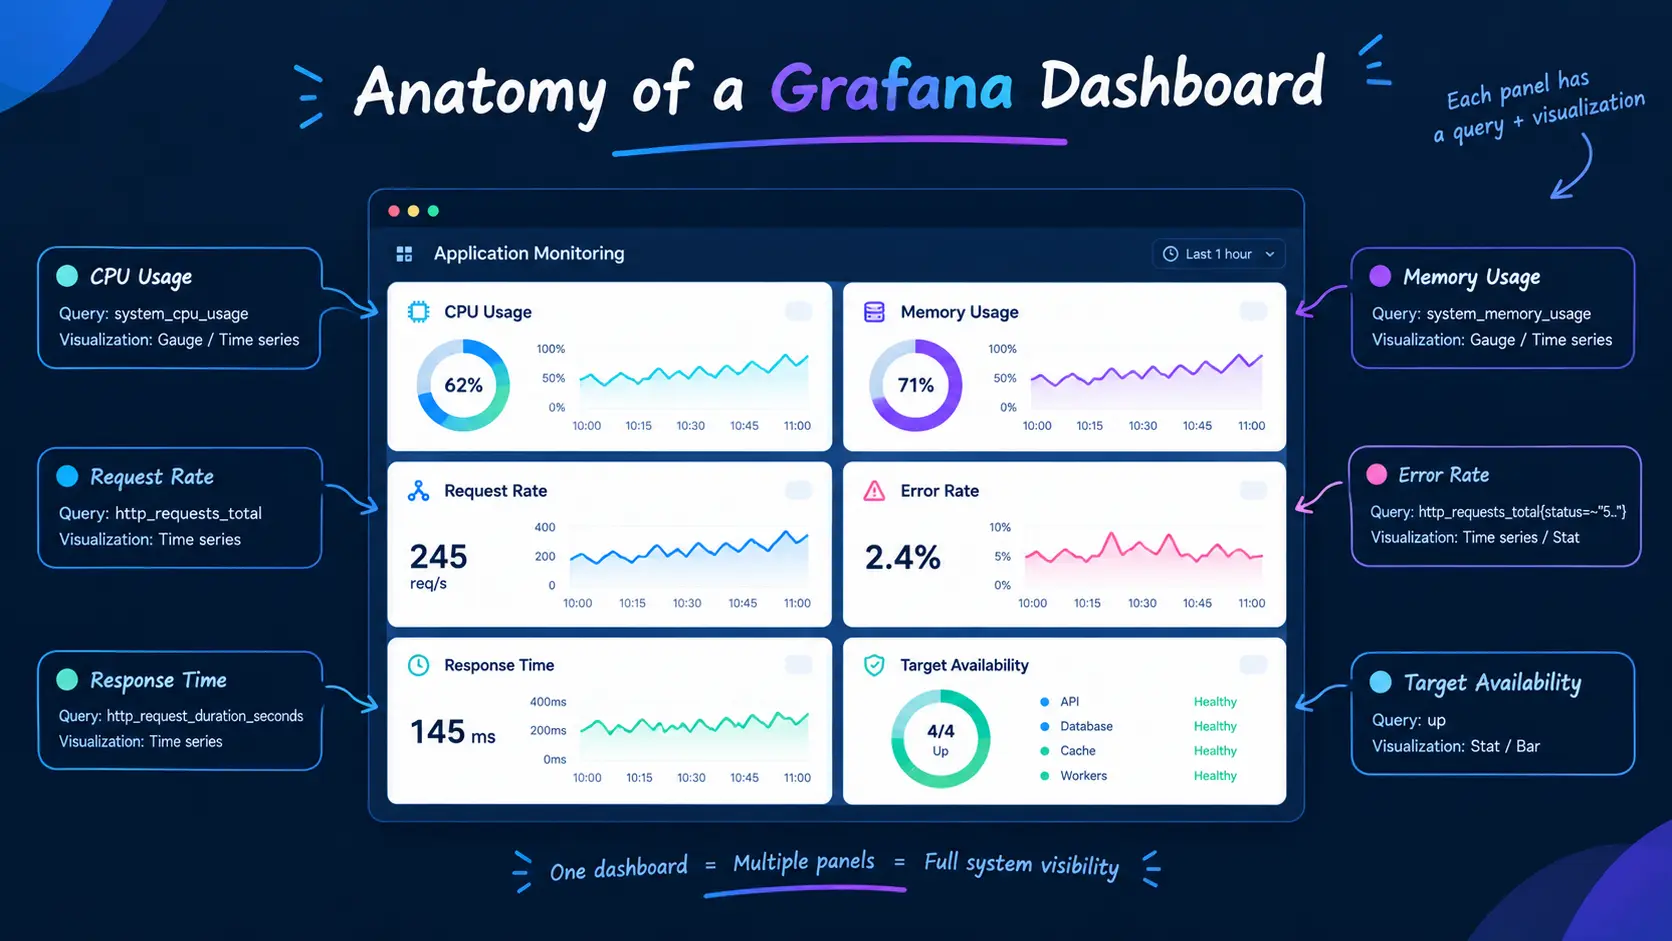
A Grafana dashboard is a collection of visualizations that help you monitor a system.
For example, a web application dashboard might contain:
Application Dashboard

┌────────────────┐ ┌────────────────┐
│ CPU            │ │ Memory         │
│ 58%            │ │ 64%            │
└────────────────┘ └────────────────┘

┌────────────────────────────────────┐
│ Requests per Second                │
│        /\      /\                  │
│   /\  /  \____/  \                 │
└────────────────────────────────────┘

┌────────────────┐ ┌────────────────┐
│ Errors         │ │ Response Time  │
│ 12             │ │ 145 ms         │
└────────────────┘ └────────────────┘
Each individual visualization is called a panel.
A panel normally contains two important things:
A query
A visualization
The query determines what data should be retrieved.
The visualization determines how that data should be displayed.
Grafana's fundamentals tutorial describes dashboards as collections of panels, with each panel using a query and visualization to present part of the overall monitoring story.
What Is a Grafana Panel?
A panel is an individual visualization inside a dashboard.
For example:
Dashboard
│
├── CPU Panel
├── Memory Panel
├── Request Rate Panel
├── Error Panel
└── Response Time Panel
Different panels can answer different questions.
Stat panel
Useful for showing a single value.
CPU Usage

   64%
Time-series panel
Useful for showing changes over time.
Requests
   |
500|       /\
400|  /\  /  \
300|_/  \/    \__
   +----------------
        Time
Table
Useful when you need detailed records.
Endpoint       Requests
/api/users       12,400
/api/login        8,920
/api/orders       6,210
The goal is not to create as many panels as possible.
The goal is to create panels that answer useful monitoring questions.
What Is Grafana Explore?
Grafana Explore is an interactive area where you can investigate your data without immediately building a permanent dashboard.
This is particularly useful when troubleshooting.
For example, suppose users report that your application is slow.
You could use Explore to investigate:
Request Rate
     ↓
Response Time
     ↓
Error Rate
     ↓
Application Logs
Grafana's official tutorial uses Explore to run ad-hoc queries against Prometheus metrics and Loki logs.
What Is PromQL?
If you use Prometheus with Grafana, you will often use PromQL.
PromQL stands for Prometheus Query Language.
It allows you to select, filter, calculate, and aggregate time-series data stored in Prometheus.
For example:
upThis can be used to inspect the availability metric for monitored targets.
Another example:
rate(http_requests_total[5m])This calculates the rate of change of a counter over a five-minute window.
Grafana's official beginner tutorial demonstrates PromQL queries such as rate() and sum() while exploring application request metrics.
For example:
sum(rate(http_requests_total[5m])) by (route)This can help you understand request traffic grouped by route.
If you are learning Prometheus and Grafana together, understanding basic PromQL is an important next step.
Grafana and Logs
Monitoring is not only about numbers.
Sometimes you need to know what actually happened.
This is where logs become useful.
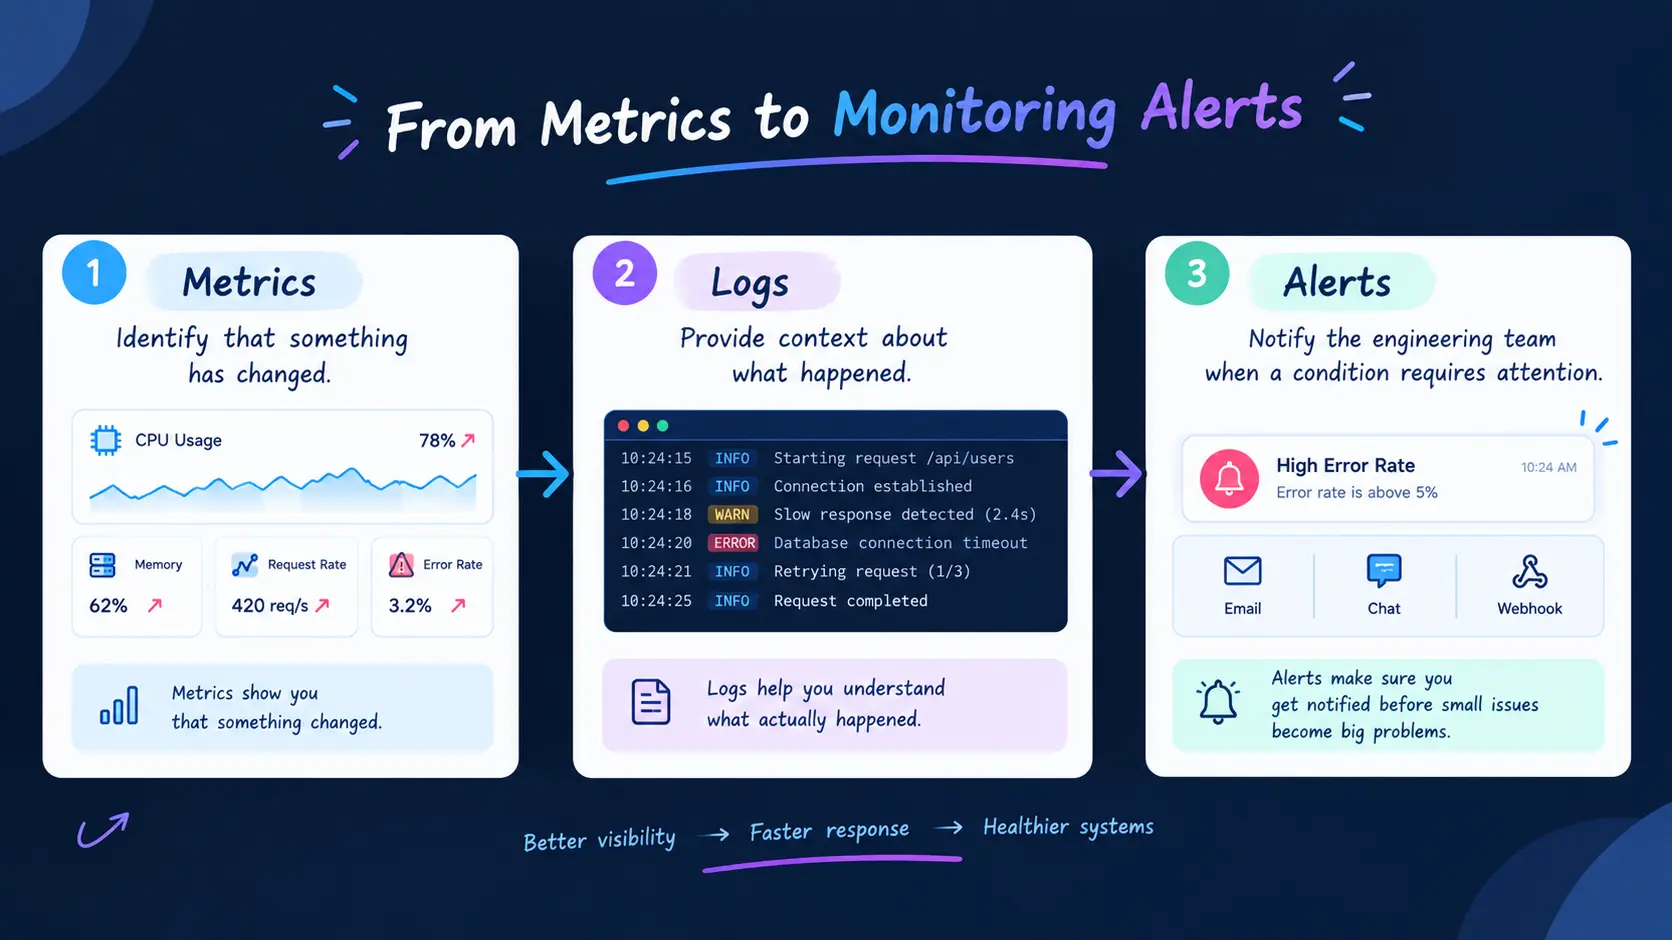
For example, a metric might tell you:
Error Rate = 8%But a log might tell you:
Database connection timeoutThe metric tells you there is a problem.
The log may help explain what happened.
Grafana can work with log data sources such as Loki. In the official fundamentals tutorial, Loki is added as a data source and Grafana Explore is used to search and filter application logs.
A simplified monitoring workflow is:
Metrics
   |
   | "Something is wrong"
   v
Logs
   |
   | "This is what happened"
   v
Investigation
This is one reason dashboards become especially useful during troubleshooting.
How to Install Grafana
There are several ways to run Grafana, depending on your environment.
Beginners commonly use:
Local installation
Docker
Grafana Cloud
For learning, Docker can be convenient because you can run Grafana together with other monitoring components.
The official Grafana fundamentals tutorial uses Docker and Docker Compose for its sample environment. It also provides an interactive learning environment for people who want to try the tutorial without configuring everything locally.
A simplified Docker-based workflow looks like:
docker --versionCheck Docker:
docker psThen start your application stack with:
docker compose up -dCheck the running containers:
docker compose psThe exact commands can vary depending on your Grafana setup and Compose configuration, so beginners should follow the installation instructions for the Grafana version and environment they are using.
Accessing Grafana
A local Grafana installation commonly uses port:
3000So you may access it through:
http://localhost:3000The official Grafana tutorial's local example uses port 3000 for Grafana.
Once Grafana is running, you can access its web interface from your browser.
From there, you can configure data sources, explore data, create dashboards, and configure alerts.
How to Create Your First Grafana Dashboard
Let's understand the basic process.
Step 1: Add a data source
Open the Grafana interface and configure your data source.
For a Prometheus setup:
Grafana
   ↓
Connections
   ↓
Data Sources
   ↓
Prometheus
Enter the connection details and test the connection.
Step 2: Open Explore
Go to:
ExploreSelect your data source.
For Prometheus, you can start experimenting with a simple query such as:
upThis lets you see whether monitored targets are reporting an up metric.
Step 3: Create a dashboard
Go to:
Dashboards
    ↓
New Dashboard
    ↓
Add Visualization
Select your data source.
Then enter your query.
For example:
upChoose an appropriate visualization.
Step 4: Configure the panel
Give your panel a useful name.
For example:
Target AvailabilityYou can then configure the visualization and display options.
Step 5: Save the dashboard
Once your panel looks correct, save the dashboard.
You can then add additional panels such as:
CPU Usage
Memory Usage
Request Rate
Error Rate
Response Time
Target Availability
Grafana's official tutorial follows the same general workflow of selecting a data source, adding a visualization, entering a query, configuring the panel, and saving the dashboard.
What Are Grafana Alerts?
A dashboard helps you see a problem.
An alert can help you know about a problem.
For example:
IF CPU > 90%
THEN trigger alert
Or:
IF error rate > threshold
THEN trigger alert
Or:
IF application is unavailable
THEN notify the team
This means engineers do not always have to stare at dashboards all day.
Grafana supports alerting workflows where alert rules can be created and connected to notification destinations. The Grafana fundamentals tutorial includes creating a Grafana-managed alert rule, configuring a contact point, triggering the alert, and displaying alert information on a dashboard.
What Are Grafana Annotations?
Imagine your application suddenly becomes slow at 2:30 PM.
You look at the dashboard and see the performance drop.
But what happened at 2:30 PM?
Maybe:
A new version was deployed
A database migration happened
Load testing started
Configuration changed
Grafana annotations allow events to be displayed directly on graphs.
For example:
Response Time

200ms |              /
150ms |-------------/---- Deployment
100ms |             |
 50ms |_____________|
      +--------------------
              Time
Now the graph provides more context.
Grafana's official tutorial specifically demonstrates using annotations to mark events such as database migrations and load tests, and explains how annotations can help correlate events with metrics.
Grafana in a Real-World DevOps Environment
A modern monitoring architecture might look like this:
                    ┌───────────────┐
                    │ Applications  │
                    └───────┬───────┘
                            │
             ┌──────────────┼──────────────┐
             │              │              │
             ↓              ↓              ↓
        Prometheus         Loki       Other Sources
          Metrics          Logs
             │              │              │
             └──────────────┼──────────────┘
                            ↓
                       ┌─────────┐
                       │ Grafana │
                       └────┬────┘
                            │
              ┌─────────────┼─────────────┐
              ↓             ↓             ↓
          Dashboards      Explore       Alerts
This allows teams to bring different types of observability information into a common interface.
Grafana can therefore become a central place for understanding system health.
Grafana for Beginners: What Should You Learn First?
If you are completely new to Grafana, do not try to learn everything at once.
A simple learning path is:
1. Learn monitoring basics
Understand:
Metrics
Logs
Time series
Monitoring
Observability
2. Learn Grafana basics
Understand:
Data sources
Dashboards
Panels
Visualizations
Explore
3. Learn Prometheus
Understand:
Metrics
Targets
Exporters
Time-series data
PromQL
4. Learn basic PromQL
Start with:
upThen learn:
rate()and:
sum()Then move to filtering and grouping with labels.
5. Build dashboards
Create dashboards for:
Server health
Application performance
API traffic
Kubernetes
Databases
6. Learn alerting
Understand:
Alert rules
Conditions
Contact points
Notifications
7. Learn troubleshooting
Combine:
Metrics + Logs + Dashboards + AlertsThis is where Grafana becomes particularly valuable for real-world monitoring.
Common Beginner Mistakes
1. Creating too many panels
More panels do not automatically mean a better dashboard.
Focus on the information you actually need.
2. Using unclear names
Instead of:
Panel 1
Panel 2
Panel 3
Use:
API Request Rate
Database Connections
Application Error Rate
Clear names make dashboards easier to understand.
3. Looking only at metrics
Metrics can tell you that something changed.
Logs can provide additional context about what happened.
Use both when troubleshooting.
4. Creating alerts for everything
If every small change creates an alert, engineers may start ignoring notifications.
Alerts should represent conditions that require attention.
5. Learning Grafana without learning the data source
Grafana is easier to understand when you also understand where your data comes from.
If you use Grafana with Prometheus, learn basic Prometheus concepts and PromQL.
Grafana FAQs
1. Is Grafana free?
Grafana has open-source offerings as well as hosted and commercial offerings. The exact features and limits depend on the Grafana edition or service you choose.
2. Is Grafana a database?
No.
Grafana is primarily used to query, visualize, monitor, and alert on data from connected data sources.
3. Is Grafana the same as Prometheus?
No.
Prometheus is commonly used for collecting and storing time-series metrics, while Grafana is used to query and visualize data.
4. Do I need Prometheus to use Grafana?
No.
Prometheus is a popular Grafana data source, but Grafana can connect to many other supported data sources.
5. Is Grafana difficult for beginners?
The basic concepts are relatively straightforward.
Start with:
 Data Source
     ↓
   Query
     ↓
   Panel
     ↓
 Dashboard
Then gradually learn PromQL, logs, alerting, annotations, and more advanced dashboard techniques.
6. What should I learn with Grafana?
A useful combination for DevOps and cloud monitoring is:
Linux
   +
Docker
   +
Prometheus
   +
PromQL
   +
Grafana
   +
Kubernetes
You do not need to master everything before starting Grafana. Learn the concepts progressively through hands-on practice.
Final Thoughts
Grafana becomes much easier to understand when you stop thinking of it as simply a "dashboard tool."
It is better to think of Grafana as a visual interface for understanding your systems.
The basic workflow is:
Collect Data
     ↓
Store Data
     ↓
Connect Data Source
     ↓
Query Data
     ↓
Visualize Data
     ↓
Monitor Trends
     ↓
Create Alerts
     ↓
Investigate Problems
For beginners, start small.
Connect Grafana to Prometheus, explore a few metrics, write simple PromQL queries, create a dashboard, and then experiment with logs and alerts.
Once you understand that workflow, you can move toward more advanced use cases such as Kubernetes monitoring, application observability, infrastructure monitoring, and production troubleshooting.
Grafana's own beginner material follows a similar progression through metrics, logs, dashboards, annotations, and alerting, making it a useful starting point for hands-on learning.
The goal is not simply to create beautiful dashboards.
The goal is to turn system data into information that helps you understand what is happening, identify problems, and respond faster.
Ready to go deeper?
Professional Training
Hands-on, mentor-led training aligned with industry certifications.
About the Author
Sharper every day
Daily tutorials, analysis, and career playbooks across all 12 Xcademia disciplines, straight to your inbox. No spam.