How Curve Used BigQuery Graph to Uncover Hidden Fraud Networks and Save $12 Million
Curve is using Google Cloud's BigQuery Graph to detect complex fraud networks at scale. By analysing billions of connections across users, devices, and payment data, the company estimates it prevented nearly $12 million in transaction losses during 2025.
Xcademia Team
Xcademia Research Team
Introduction
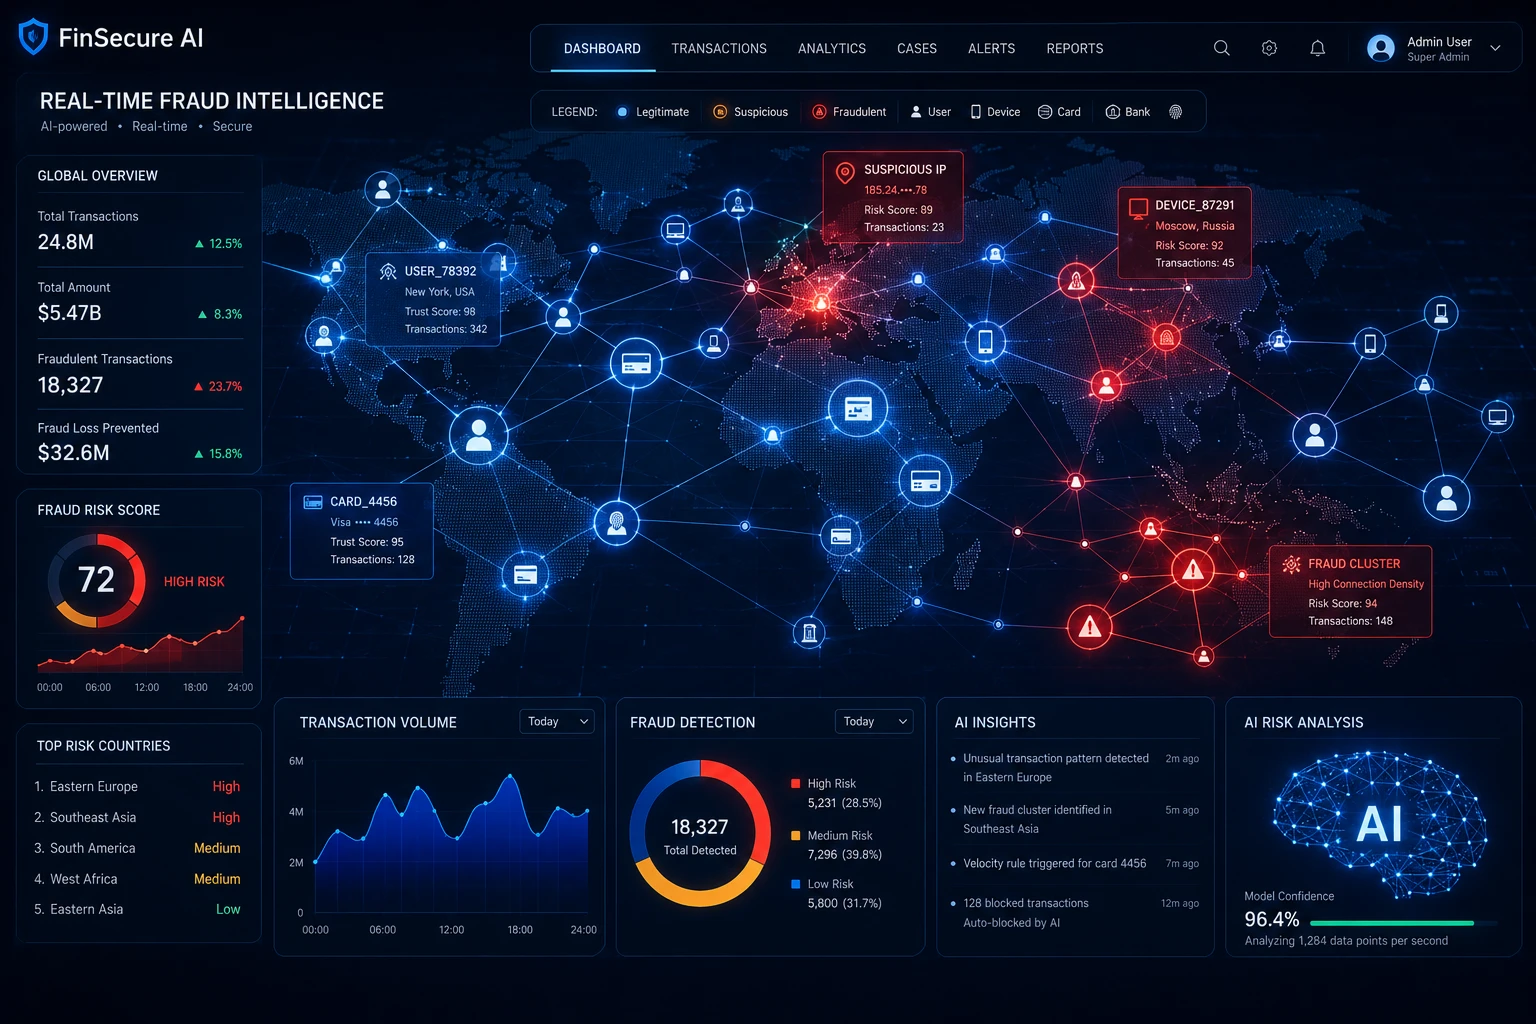
As digital payments continue to grow, financial institutions face increasingly sophisticated fraud schemes. Traditional fraud detection systems are effective at identifying suspicious individual transactions, but they often struggle to reveal the broader networks that organised fraud groups use to operate.
UK-based fintech company Curve has tackled this challenge by adopting BigQuery Graph, a graph analytics capability within Google Cloud. The move has enabled the company to analyse complex relationships between accounts, devices, cards, and other identifiers at massive scale, helping uncover hidden fraud rings that would otherwise remain undetected.
According to Curve, the initiative contributed to an estimated $12 million in prevented transaction losses during 2025, demonstrating the growing value of graph analytics in modern fraud prevention.
Why Traditional Fraud Detection Was Not Enough
Curve operates a financial super-app that allows customers to consolidate multiple debit and credit cards into a single application and payment card. Managing millions of users means processing enormous volumes of transaction and behavioural data.
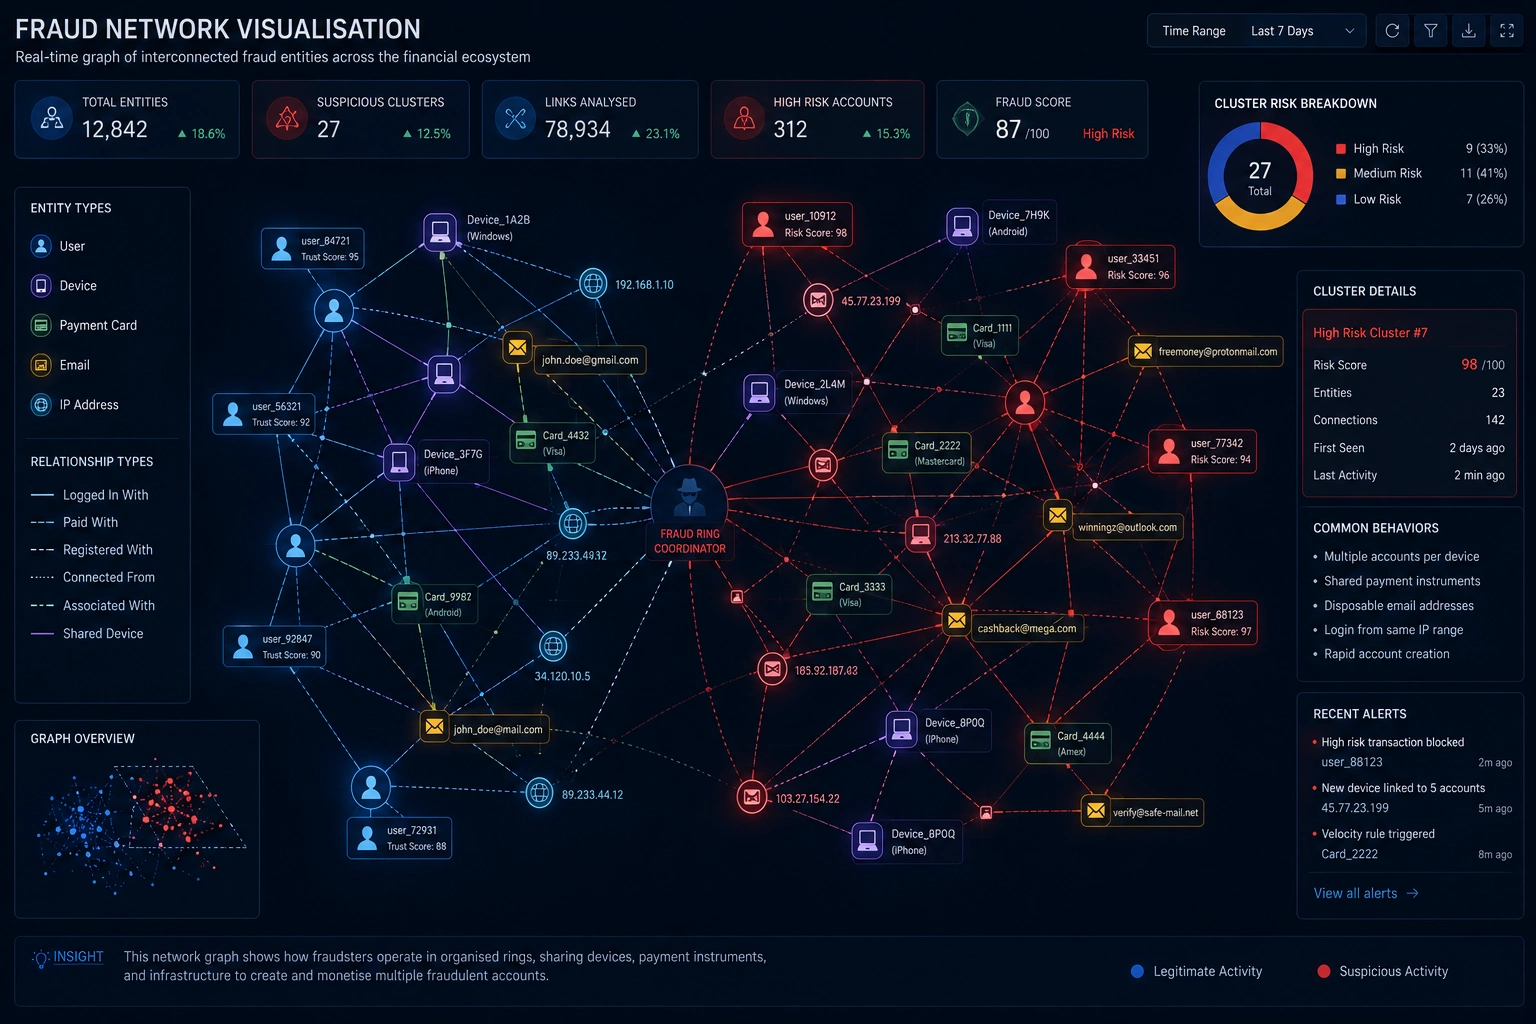
While conventional fraud systems can flag suspicious transactions, organised fraud networks typically involve multiple interconnected accounts sharing common characteristics such as:
Devices
Funding cards
Phone numbers
Email addresses
IP addresses
Other digital identifiers
Detecting these relationships requires what's known as multi-hop analysis, where investigators trace chains of connections across several entities.
For example:
User A shares a device with User B
User B shares a payment card with User C
User C is already linked to known fraudulent activity
Finding these connections using traditional SQL queries becomes increasingly difficult as datasets grow into millions of users and billions of relationships.
The Multi-Hop Challenge at Scale
Curve identified two major obstacles when attempting to expand fraud network analysis using traditional database methods.
Computational Complexity
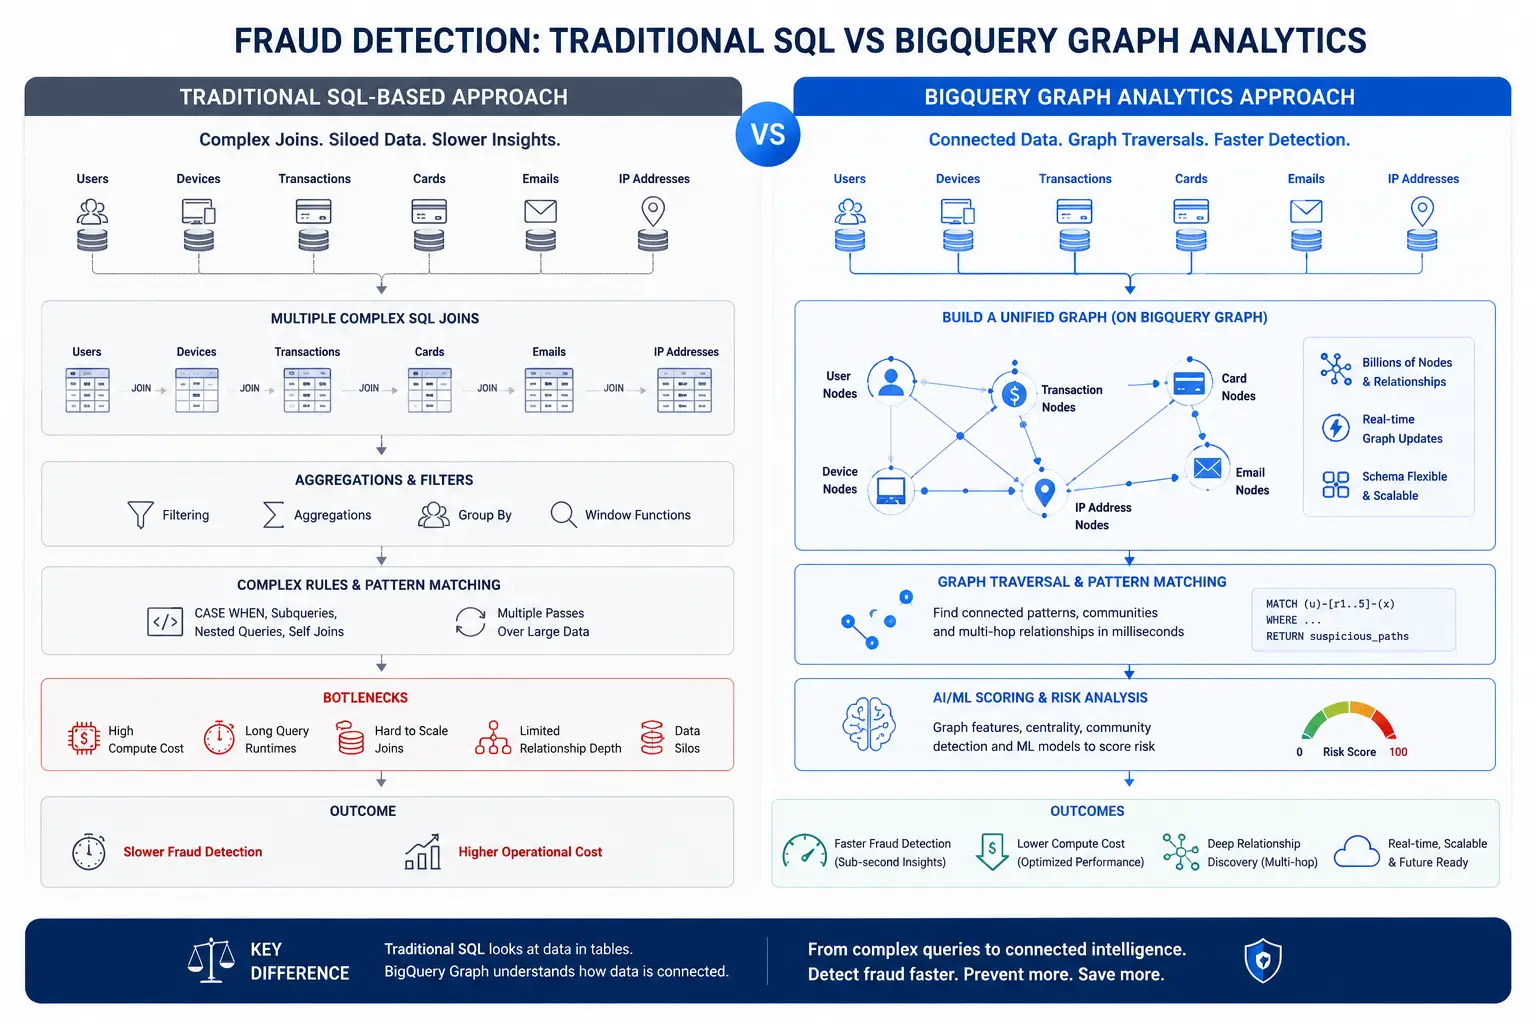
Multi-hop investigations require numerous self-joins across enormous datasets. As connections expand across multiple layers, query complexity increases dramatically.
At Curve's scale, these operations became costly, difficult to maintain, and slower to execute.
Massive Data Volumes
The company manages datasets containing billions of potential relationships across customers, devices, cards, and other identifiers.
Traditional relational databases often face performance limitations when processing such large and interconnected datasets.
As fraud networks evolved, Curve needed a more scalable method for analysing relationships rather than individual records.
How BigQuery Graph Changed the Approach
Instead of moving data into a separate graph database, Curve adopted BigQuery Graph directly within its existing BigQuery environment.
This allowed the organisation to maintain its current data architecture while adding native graph analytics capabilities.
The key innovation was modelling the payment ecosystem as a property graph:
Users become nodes
Shared identifiers become edges
Relationships become traversable connections
Rather than building lengthy SQL queries filled with joins, analysts can use Graph Query Language (GQL) to identify suspicious patterns more naturally.
This simplified both development and operational workflows.
Key Advantages
Analysis Across Billions of Connections
BigQuery Graph enables large-scale traversal across:
User relationships
Device relationships
Payment card relationships
Identity signals
Unified Analytics Environment
Because graph analytics runs directly inside BigQuery, teams can combine:
Graph analysis
SQL queries
Search capabilities
Machine learning workflows
within a single platform.
Reduced Complexity
Existing SQL pipelines continue generating nodes and relationship data, while graph queries handle network traversal and fraud discovery.
This eliminates the need to maintain separate graph infrastructures and specialised data pipelines.
Measurable Business Results
The deployment delivered significant operational and financial benefits for Curve.
$12 Million in Fraud Loss Prevention
Curve estimates that graph-powered automated fraud controls prevented approximately $12 million in transaction losses during 2025.
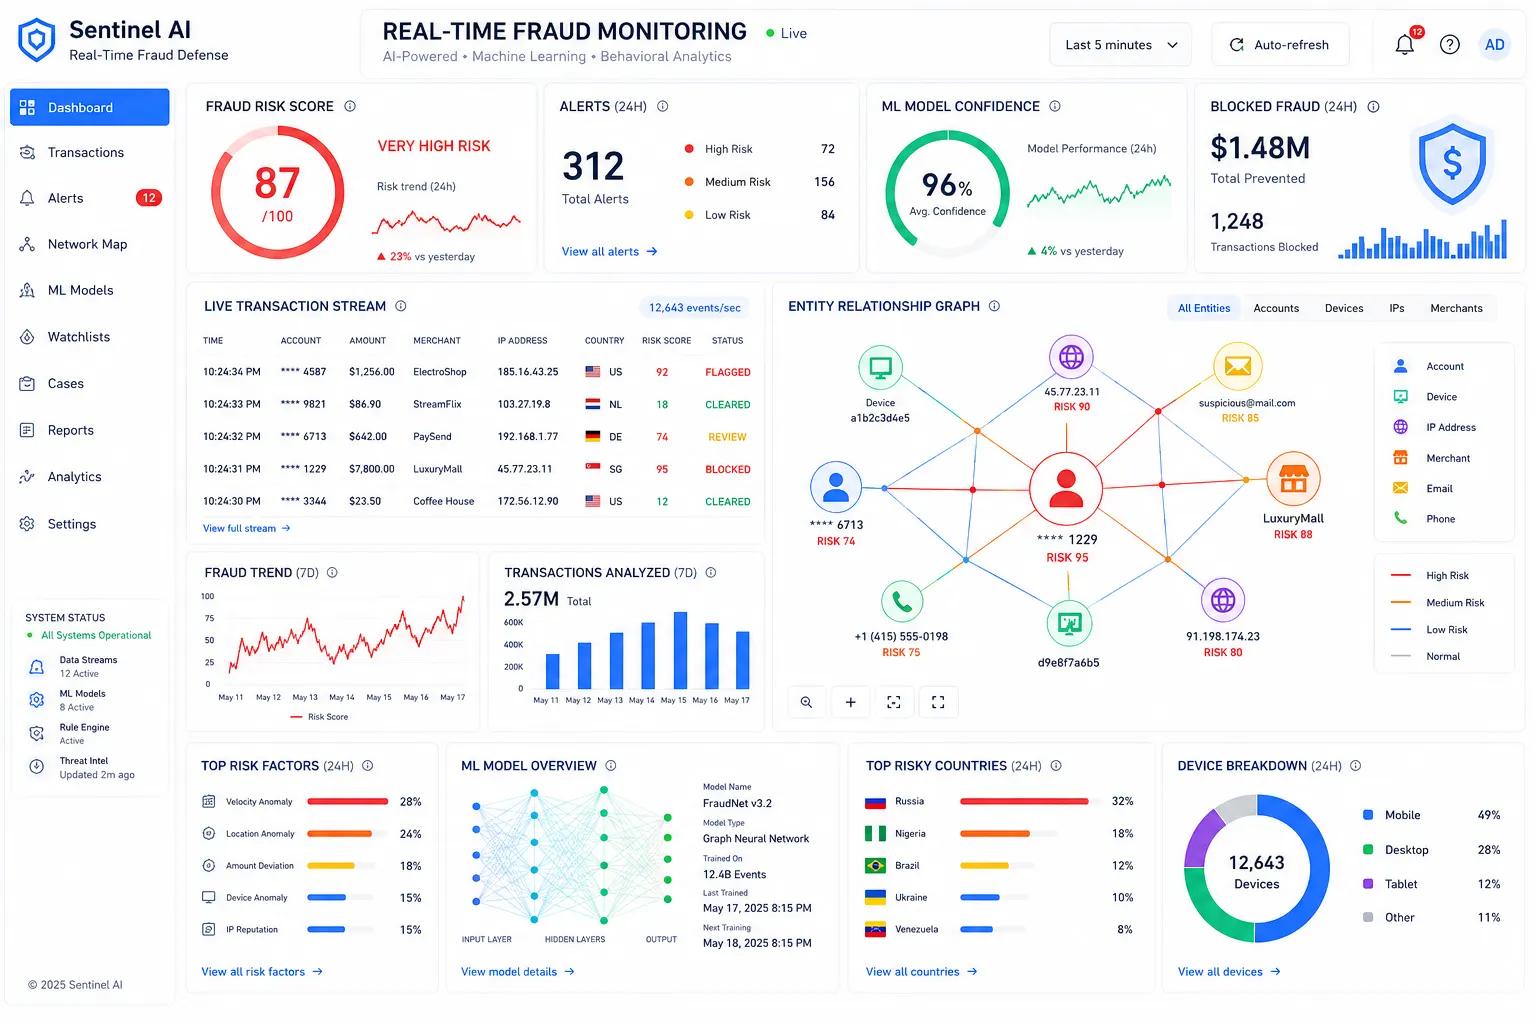
72% Fraud Detection Accuracy
The company's graph-based fraud detection achieved around 72% accuracy when identifying fraudulent users.
This level of precision helps fraud analysts focus on high-confidence investigations while reducing time spent on false positives.
Faster Fraud Rule Updates
Before implementing graph analytics, Curve's fraud rules were largely limited to simpler one-hop investigations.
With GQL and graph traversal capabilities, the company can:
Build more advanced fraud rules
Refresh detection logic more frequently
Adapt faster to emerging criminal tactics
Improved Machine Learning Workflows
Graph-based features are increasingly valuable inputs for machine learning models.
Faster graph traversal enables:
Better model training
More relevant behavioural features
Improved fraud prediction capabilities
The company is now moving toward micro-batch and streaming graph analysis to provide fresher intelligence for fraud monitoring systems.
The Future: Real-Time Network Intelligence
Curve's graph analytics journey is still evolving.
The company is currently working to incorporate some of its highest-volume signals into fraud detection processes, including:
Billions of IP address relationships
Real-time network analysis
Streaming graph traversals
Curve is also exploring graph visualisation capabilities that would allow analysts to visually investigate emerging fraud networks as they develop.
These initiatives could significantly improve the speed at which threats are identified and mitigated.
Key Lessons for Financial Institutions
Curve's experience highlights several important lessons for organisations dealing with fraud at scale:
Think Beyond Individual Transactions
Fraud often exists within networks of relationships rather than isolated events.
Use Graph Analytics for Connected Data
Graph databases and graph query engines are particularly effective for uncovering hidden patterns among interconnected entities.
Keep Analytics Close to the Data
Integrating graph capabilities directly into existing data platforms reduces complexity, migration costs, and operational overhead.
Combine Graph Analytics with Machine Learning
Graph-derived features can significantly enhance fraud detection models and improve prediction accuracy.
Move Toward Real-Time Intelligence
As fraud tactics evolve rapidly, organisations benefit from analytics systems capable of near real-time insights.
Conclusion
Curve's adoption of BigQuery Graph demonstrates how graph analytics is becoming a critical tool in the fight against financial crime. By shifting from traditional relational analysis to network-based intelligence, the company has gained the ability to uncover hidden fraud rings, improve detection accuracy, and prevent millions of dollars in losses.
As financial services organisations continue to face increasingly connected and sophisticated fraud schemes, graph analytics is likely to play a growing role in cybersecurity, risk management, and fraud prevention strategies worldwide.
Source: Google Cloud Blog
About the Author