
Google Cloud Brings Measures to BigQuery Graphs for More Trusted Agentic Workloads
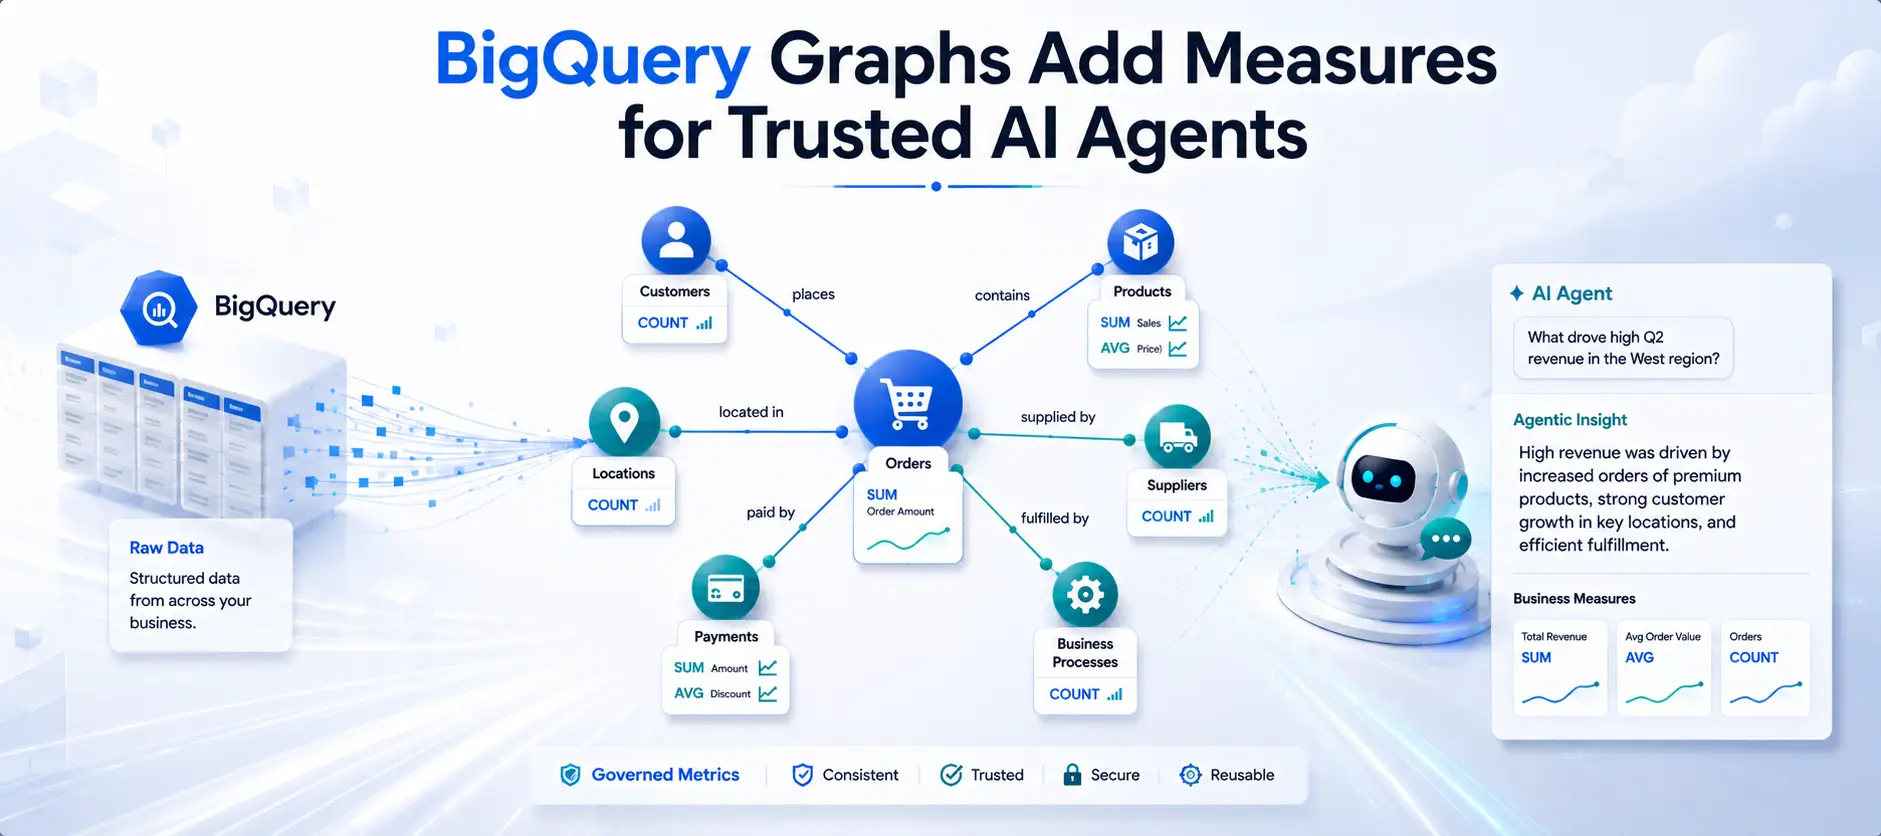
Google Cloud is adding measures to BigQuery Graphs in preview, combining governed business metrics with relationship-aware graph analysis so AI agents can reason across complex enterprise data with greater consistency.
Xcademia Team
Xcademia Research Team
Google Cloud Brings Measures to BigQuery Graphs for More Trusted Agentic Workloads
As enterprises move from basic chat assistants toward more autonomous AI agents, the challenge is no longer simply giving an agent access to more data.
The bigger challenge is helping an agent understand how that data is connected.
Google Cloud says agents working directly with raw tables can struggle to understand the relationships and dependencies behind business events. A flat table may tell an agent what happened, but it may not provide enough context to determine why it happened.
Google Cloud is addressing this problem by adding measures to BigQuery Graph, currently available in preview.
The capability combines governed business metrics with relationship mapping inside BigQuery Graphs. The goal is to give agentic workloads both the quantitative context provided by business measures and the relationship context represented by a property graph.
Why Relationships Matter for Agentic AI
Traditional relational tables are effective for many analytical workloads, but complex business questions can require multiple connected entities and several steps of reasoning.
Google Cloud illustrates the problem with a retail example.
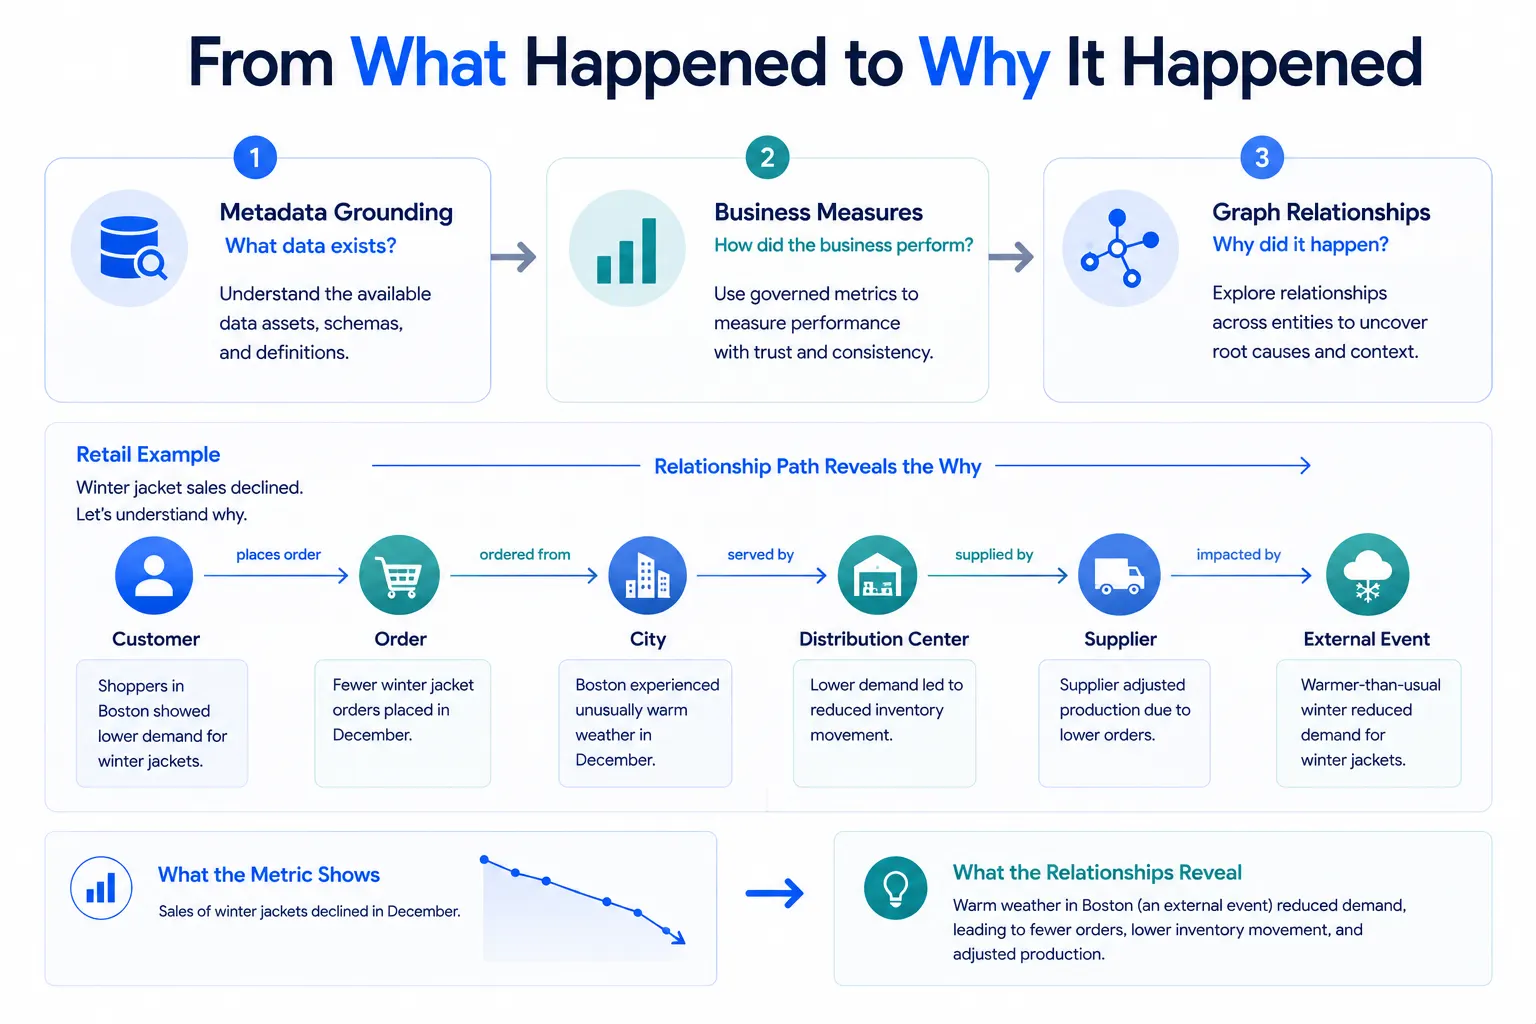
An agent may be asked why winter jacket sales declined by 12% in Seattle. A conventional query can identify the 12% decline.
But answering the follow-up question, why did sales decline?, requires understanding the relationships between different business entities.
The relevant path could involve:
Seattle orders → Distribution centers → Suppliers → Regional storm delays
Without those relationships, an agent could identify the metric but struggle to connect the contributing factors.
Google Cloud says this lack of relationship context can lead to incorrect operational recommendations. In its example, an agent could suggest a 15% markdown campaign even though the underlying issue may be supply-chain disruption.
The broader issue is that organizations often maintain business relationships and analytical metrics in separate systems. One team may maintain relationship information in a graph database while another maintains metrics through SQL-based analytical systems.
Agents then have to combine information from those separate systems at runtime.
Google Cloud argues that this can introduce additional complexity and inconsistent KPI calculations.
Measures Bring Metrics Into BigQuery Graphs
Google Cloud says Measures in BigQuery Graph allow organizations to map existing tables to a property graph in place, without requiring ETL for this mapping.
The company describes the resulting analytical model through three complementary layers:
Metadata grounding identifies what data is available.
Business measures calculate how the business performed.
Relationship mapping helps uncover why an event occurred.
This brings metrics and relationships closer together within the same analytical environment.
For agentic workloads, that distinction is important.
An agent may need SQL-style calculations for questions involving numerical measurements, while graph traversal can help it follow relationships across entities.
Google Cloud describes this as knowing when an agent needs a calculator and when it needs a map.
How BigQuery Graph Measures Work
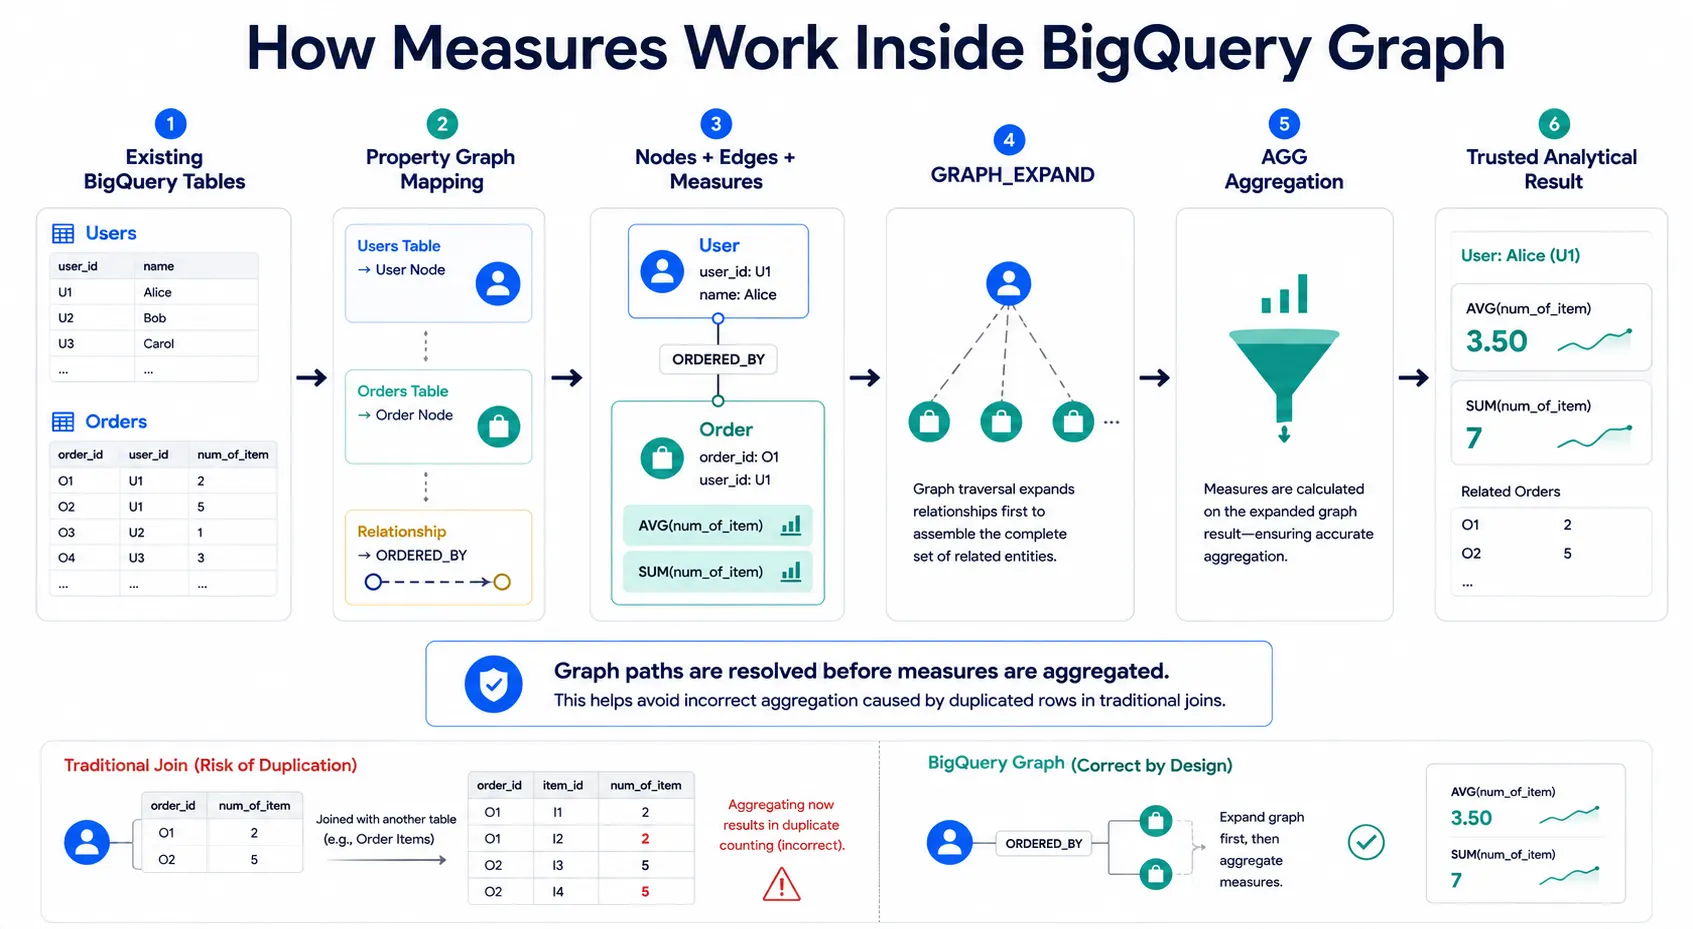
The technical challenge comes from combining graph traversal with aggregation.
According to Google Cloud, conventional SQL joins during graph traversals can duplicate rows. When those duplicated rows are aggregated, the resulting calculations can become incorrect.
BigQuery Graph addresses this by allowing data modelers to define a MEASURE, such as SUM or AVG, directly within the Property Graph DDL.
Queries can then use standard SQL together with the GRAPH_EXPAND function and the AGG aggregator.
This allows graph traversal and defined measures to be used together when analyzing connected data.
Google Cloud provides an example using the public thelook_ecommerce dataset. The example maps the existing tables into a property graph inside the user's own project while referencing the read-only public tables.
Example: Creating and Querying a BigQuery Graph With Measures
Step 1: Map the Graph Inside Your Project
The first query creates the property graph, defines users and orders as nodes, establishes the relationship between orders and users, and adds measures for the average and total number of items per order.
-- 1. Map the graph inside YOUR project

CREATE OR REPLACE PROPERTY GRAPH `YOUR_PROJECT_ID.YOUR_DATASET.thelook_ecommerce_graph`
NODE TABLES(
  `bigquery-public-data.thelook_ecommerce.users` AS User
    KEY(id)
    LABEL User PROPERTIES(id, city, country),
  `bigquery-public-data.thelook_ecommerce.orders` AS Order
    KEY(order_id)
    LABEL Order PROPERTIES(
      order_id,
      MEASURE(AVG(num_of_item)) AS avg_items_per_order,
      MEASURE(SUM(num_of_item)) AS total_items
    )
)
EDGE TABLES(
  `bigquery-public-data.thelook_ecommerce.orders` AS OrderedBy
    SOURCE KEY(order_id) REFERENCES Order(order_id)
    DESTINATION KEY(user_id) REFERENCES User(id)
    LABEL ORDERED_BY
);

-- 2. Query your new graph with standard SQL using standard {Label}_{Property} column outputs

SELECT
  User_city AS city,
  ROUND(AGG(Order_avg_items_per_order), 2) AS agg_avg_items,
  ROUND(AGG(Order_total_items), 2) AS agg_total_items
FROM GRAPH_EXPAND("YOUR_PROJECT_ID.YOUR_DATASET.thelook_ecommerce_graph")
GROUP BY User_city
ORDER BY agg_total_items DESC
LIMIT 10;
This example demonstrates how BigQuery Graph combines relationship traversal with defined business measures. The graph provides the relationship structure, while the measures provide the calculations used to analyze the connected data.
BigQuery Studio Adds Visual Graph Modeling
Google Cloud is also bringing graph-management capabilities into BigQuery Studio.
The company highlights a visual graph modeler designed to make property graph creation and management accessible without requiring users to manually write complex DDL scripts.
The interface provides a drag-and-drop approach for building and mapping:
Property graphs
Nodes
Edges
Relationships
This is intended to make graph modeling more accessible to both developers and business users.
Google Cloud is also integrating BigQuery Graphs with Conversational Analytics.
With this integration, users can interact with graph data using natural language. Google Cloud says Conversational Analytics agents can navigate the deterministic relationships defined in the graph and convert natural-language questions into GoogleSQL or ISO GQL queries.
The company positions the relationship-aware approach as a way to constrain the boundaries of the agent's reasoning and maintain semantic consistency.
Looker Integration Brings Metrics and Semantics Together
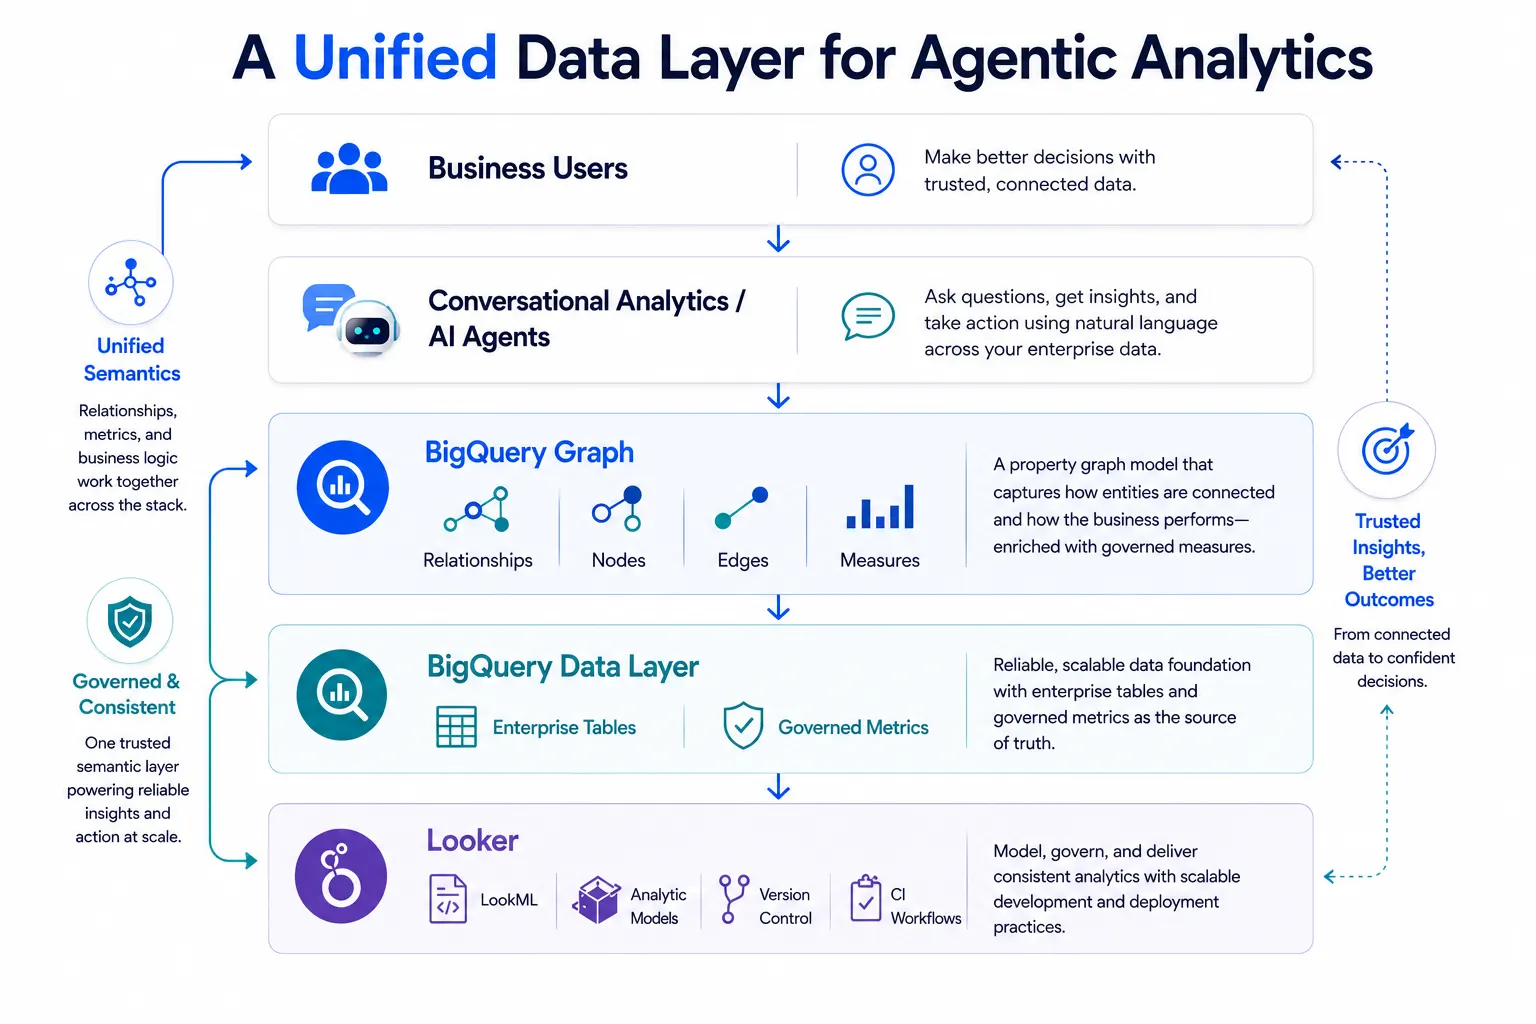
Google Cloud is also connecting BigQuery Graphs with Looker through in-database analytic models.
The goal is to reduce fragmentation between data modeling, business metrics and graph definitions.
Google Cloud describes two approaches.
Database-Managed Models
With sql_analytic_model_name, Looker can point to a database-defined BigQuery Graph and map standard LookML dimensions and measures to graph properties.
This allows analytical logic to remain defined at the database layer.
Looker-Managed Models
With derived_analytic_model, organizations can define the BigQuery Graph schema directly within a LookML view.
Looker can then dynamically generate and execute the SQL DDL required to maintain the graph in BigQuery.
This approach brings graph definitions into existing Looker development workflows.
Enterprise DevOps Workflows
Google Cloud also highlights support for managing the graph lifecycle through the Looker IDE, Git-based version control and continuous integration workflows.
The intended result is that important business KPIs can remain consistent across analytical workflows.
What This Means for Agentic Workloads
The introduction of measures to BigQuery Graph reflects a broader industry shift toward giving AI agents more structured business context rather than simply exposing larger volumes of raw data.
For enterprises, this could mean designing agentic applications around relationships, governed metrics and semantic consistency as well as language-model capabilities.
The announcement does not claim that graph-based reasoning eliminates incorrect AI responses. Instead, Google Cloud's approach focuses on providing agents with a more structured representation of enterprise data and predefined analytical logic.
That distinction matters.
An AI agent can generate a fluent answer from incomplete context. A graph can provide explicit relationships, while governed measures can define how specific business metrics should be calculated.
Together, those elements can create a more structured foundation for analytical agent workflows.
The Bigger Data Analytics Picture
BigQuery Graph with measures sits at the intersection of three trends:
Graph analytics for understanding interconnected business entities.
Semantic modeling for maintaining consistent definitions of business metrics.
Agentic AI for allowing software agents to investigate and act on enterprise information.
The combination is significant because agentic systems increasingly need more than access to data. They need access to data with context and meaning.
Google Cloud's approach keeps graph relationships and analytical measures within the BigQuery environment while extending the experience into BigQuery Studio, Conversational Analytics and Looker.
For organizations building enterprise AI agents, the development highlights a practical consideration: the quality of an agent's reasoning depends not only on the model, but also on how clearly the underlying business data, relationships and metrics are represented.
Source: Google Cloud Blog
About the Author