
Course Overview
Finance teams increasingly rely on modern business intelligence tools to transform complex financial data into clear insights for leadership. Microsoft Power BI enables professionals to create dynamic dashboards, automate reporting workflows, and deliver visual financial analysis in real time.
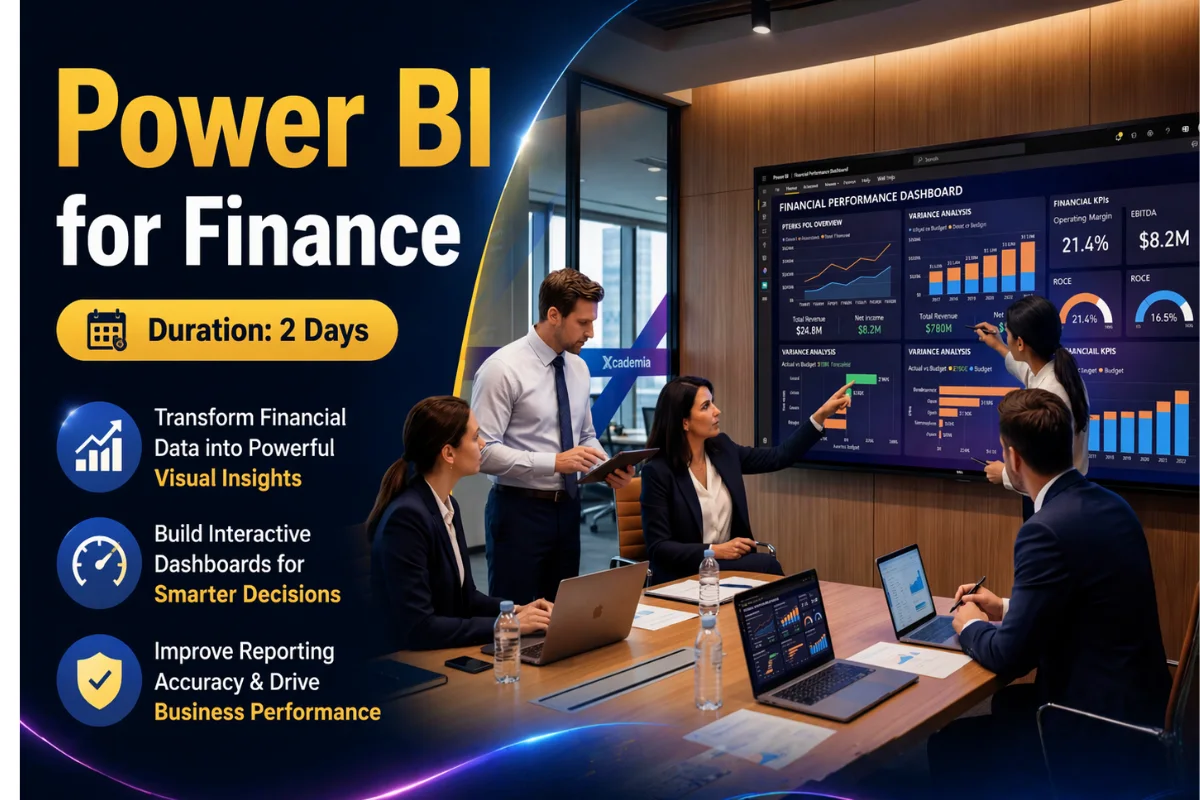
In this mentor-led programme, learners explore how to build finance-focused dashboards including profit and loss (P&L) reports, variance analysis packs, and executive-level summaries. Through practical scenarios, participants connect financial datasets, build data models, and design interactive reports that support management decision-making.
By the end of the programme, participants will be able to design structured financial dashboards, automate recurring reporting processes, and deliver clear financial commentary supported by visual insights.
Hands-On Learning
Participants build P&L dashboards, variance reports, and executive financial dashboards using realistic finance datasets.
Mentor-Led Sessions
Experienced mentors guide learners through dashboard design, financial modelling logic, and reporting best practices.
Career-Ready Skills
Develop modern financial analytics and dashboard reporting capabilities used in FP&A and finance analytics roles.
Learning Outcomes
Design finance-focused Power BI dashboards
Analyse P&L performance using visual analytics
Implement automated variance reporting
Evaluate financial trends through data modelling
Communicate financial insights using dashboards
Lead modern finance reporting initiatives
Prerequisites
Basic Microsoft Excel knowledge
Understanding of financial reporting concepts
Experience working with spreadsheets or data
Detailed Syllabus
Step-by-step learning journey from basics to professional practice
Topics Covered
- Course orientation and finance analytics goals
- Overview of Power BI for finance teams
- Installing and navigating Power BI Desktop
- Understanding finance data sources
Skills You'll Gain
Master these in-demand skills through hands-on practice
Career Progression
A clear view of the roles this programme supports, what typically comes next, and where learners progress over time
Ways to Learn
Choose the learning format that works best for you and your team
Live Online
Instructor-Led Training
Join live instructor-led sessions from anywhere. Interactive, engaging, and flexible.
- Live instructor interaction (real-time)
- Trainer-led walkthroughs and real examples
- Guided resources and session notes provided
- Structured Q&A and practical discussion
Price per person
Group enrolments and early planning options available.
All prices are exclusive of VAT where applicable. Group enrolments and custom packages available on request.
Prefer a Faster, Personalised Route into IT?
Not everyone learns best in a group. If you want focused guidance, faster clarity, and confidence you can use on the job, our 1-to-1 Fast-Track Training gives you private, mentor-led support tailored to your experience and goals.
"Many learners choose 1-to-1 when they want understanding, not memorisation."
Exam & Certification Information
Everything you need to know about the certification exams
Important Information
You will receive an Xcademia certificate of completion based on participation and successful completion of labs and scenario simulations.
Credential
Certificate of Completion
On successful completion of Power BI for Finance, learners receive an Xcademia Certificate of Completion. This standalone certificate is issued directly by Xcademia and is aligned with globally recognised frameworks and best practices.
Frequently Asked Questions
Everything you need to know about this course
Yes. The course begins with the fundamentals and progresses to finance-focused dashboards and reporting.
Ready to Start Your Learning Journey?
Take the next step in your professional development